SOM cluster: 1347
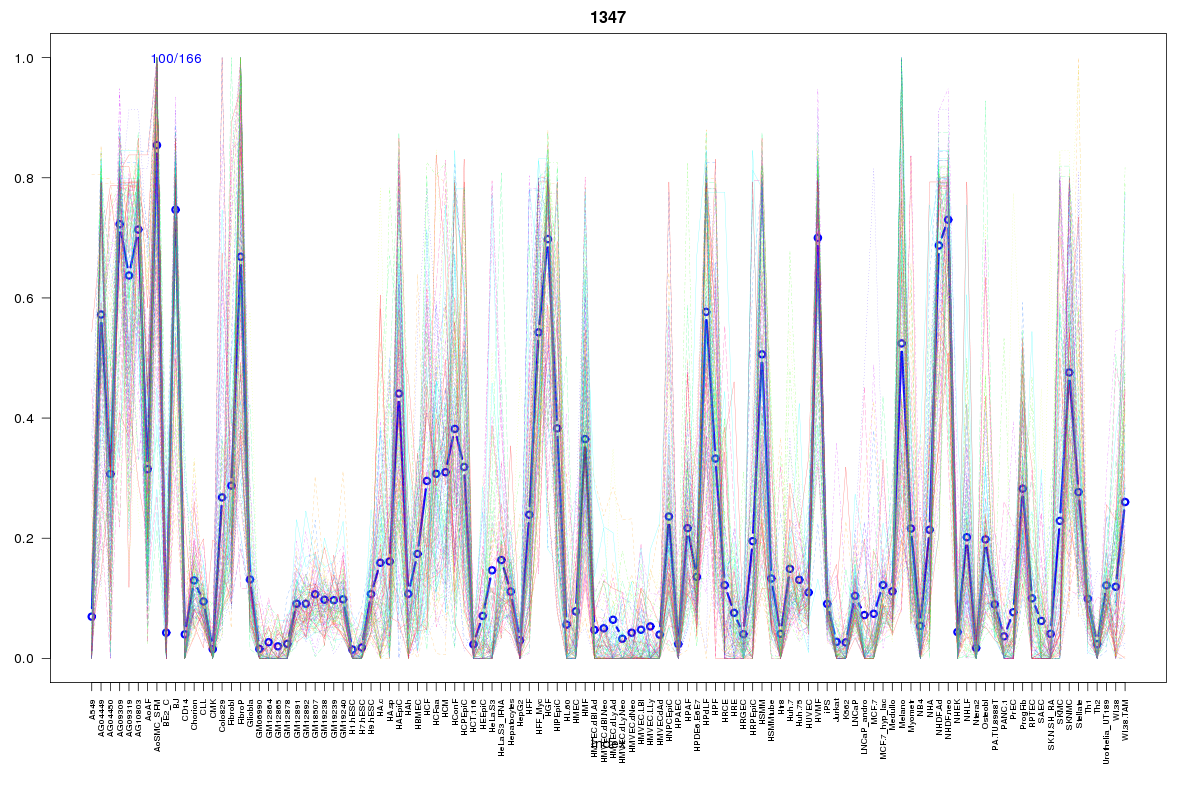
Cluster Hypersensitivity Profile

Genomic Location Trend
These plots show the distribution of the DHS sites surrounding the Transcript Start Site of the nearest gene.
Stats
Number of sites: 166Promoter: 1%
CpG-Island: 0%
Conserved: 55%
Enriched Motifs & Matches
Match Detail: [Jaspar]
|
| ||
|---|---|---|
| Sites: 50/100 | e-val: 0.000000000000019 | ||
| Factor | e-val(match) | DB |
| CEBPA | 0.00000035627 | JASPAR |
| HLF | 0.00035559 | JASPAR |
| Lhx3 | 0.0028953 | JASPAR |
| NFIL3 | 0.0031265 | JASPAR |
| T | 0.0034049 | JASPAR |
BED file downloads
Top 10 Example Regions
| Location | Gene Link | Dist. |
|---|---|---|
| chr8: 124033960-124034110 | TBC1D31 | 45.2 |
| chr8: 124033960-124034110 | RP11-557C18.3 | 45.2 |
| chr7: 137655120-137655270 | AKR1D1 | 46.91 |
| chr8: 120581240-120581390 | ENPP2 | 47.86 |
| chr8: 120581240-120581390 | RP11-99I9.2 | 47.86 |
| chr8: 95299260-95299410 | GEM | 48.01 |
| chr8: 95299260-95299410 | RAD54B | 48.01 |
| chr1: 43288820-43288970 | LEPRE1 | 49.47 |
| chr1: 43288820-43288970 | ERMAP | 49.47 |
| chr6: 38580280-38580430 | GLO1 | 53.12 |