SOM cluster: 1350
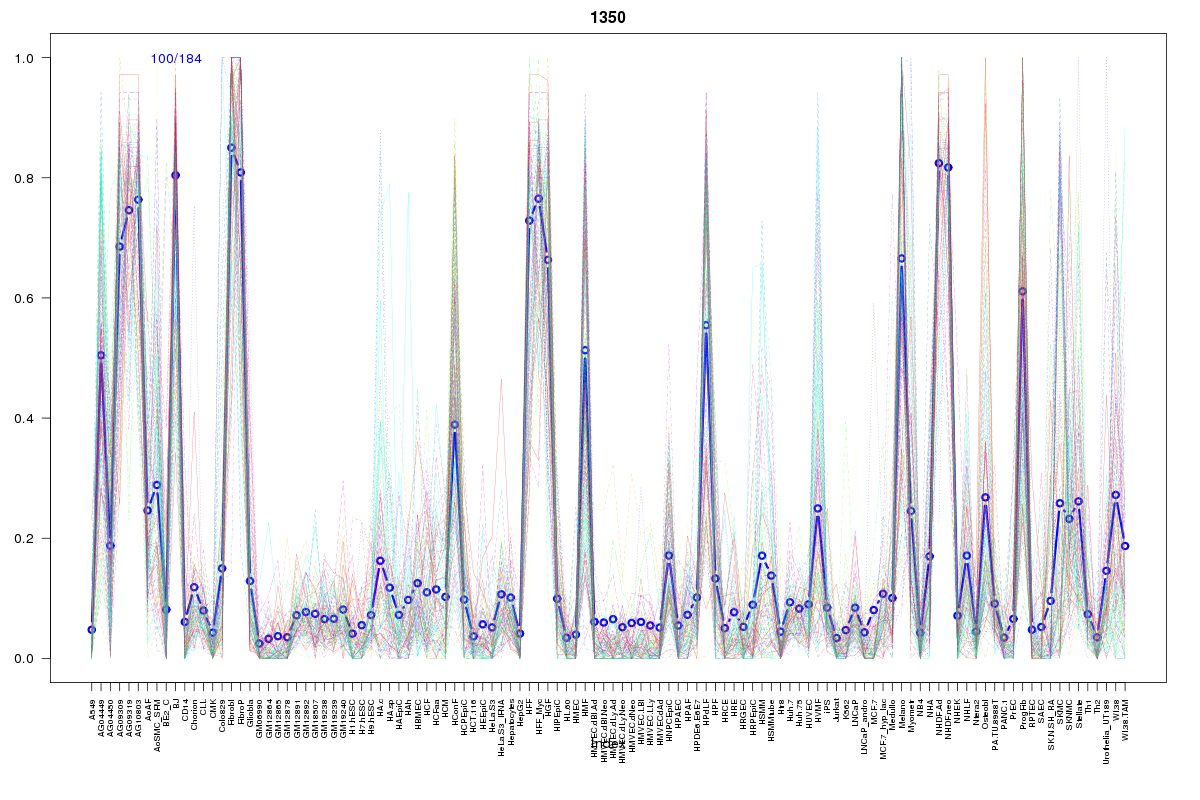
Cluster Hypersensitivity Profile

Genomic Location Trend
These plots show the distribution of the DHS sites surrounding the Transcript Start Site of the nearest gene.
Stats
Number of sites: 184Promoter: 0%
CpG-Island: 0%
Conserved: 46%
Enriched Motifs & Matches
Match Detail: [Jaspar]
|
| ||
|---|---|---|
| Sites: 43/100 | e-val: 3.5e-37 | ||
| Factor | e-val(match) | DB |
| ARID3A | 0.000017876 | JASPAR |
| Prrx2 | 0.000047883 | JASPAR |
| TAL1::TCF3 | 0.000060462 | JASPAR |
| Tcfcp2l1 | 0.00020165 | JASPAR |
| Pdx1 | 0.00046045 | JASPAR |
BED file downloads
Top 10 Example Regions
| Location | Gene Link | Dist. |
|---|---|---|
| chrX: 3244840-3244990 | ASS1P4 | 40.66 |
| chrX: 3244840-3244990 | MXRA5 | 40.66 |
| chr3: 13554980-13555130 | HDAC11 | 55.9 |
| chr3: 13554980-13555130 | FBLN2 | 55.9 |
| chr3: 13554980-13555130 | NUP210 | 55.9 |
| chr6: 41562180-41562330 | MDFI | 57.48 |
| chr6: 41562180-41562330 | FOXP4 | 57.48 |
| chr8: 19170100-19170250 | SH2D4A | 59.13 |
| chr2: 160084600-160084750 | BAZ2B | 60.9 |
| chr11: 64516060-64516210 | MAP4K2 | 65.21 |