SOM cluster: 136
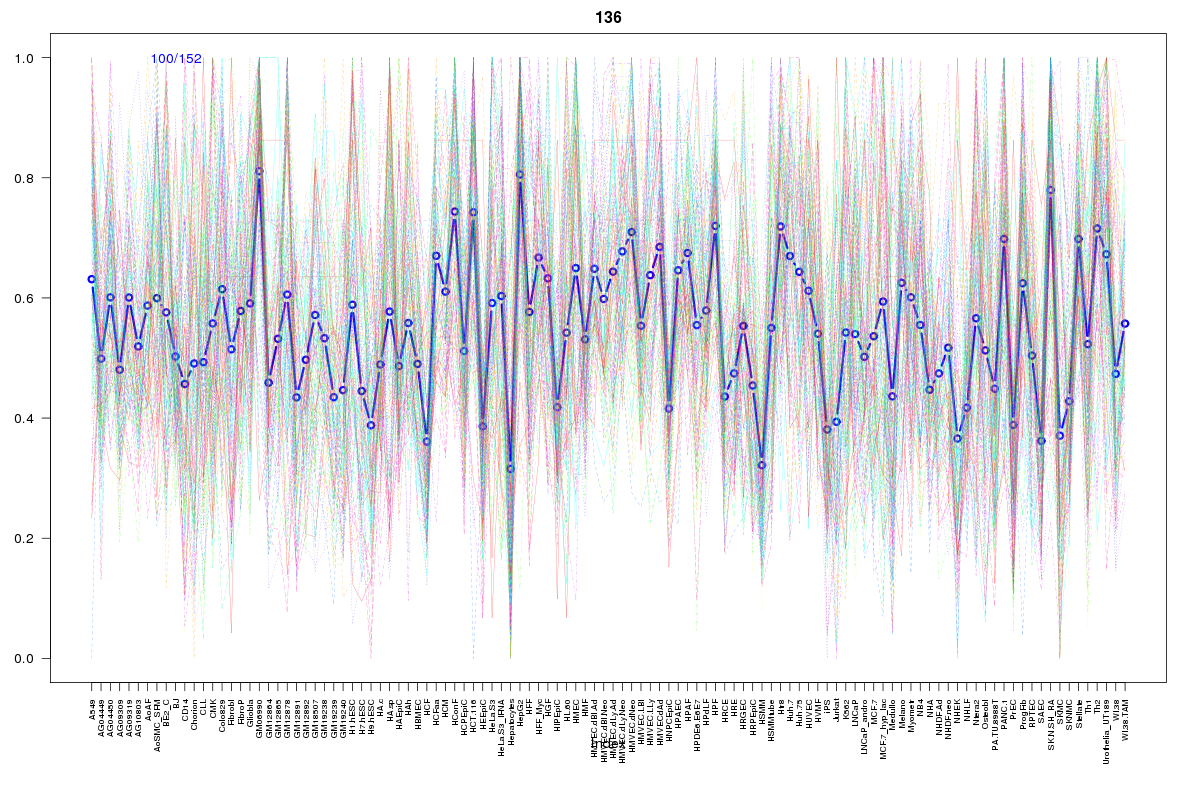
Cluster Hypersensitivity Profile

Genomic Location Trend
These plots show the distribution of the DHS sites surrounding the Transcript Start Site of the nearest gene.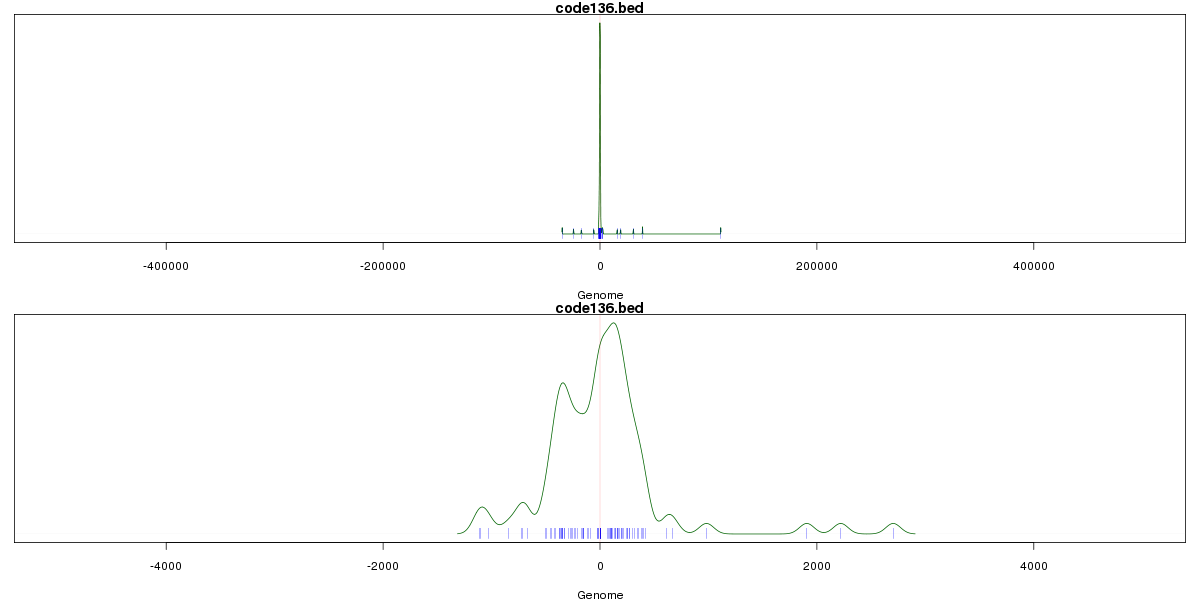
Stats
Number of sites: 152Promoter: 62%
CpG-Island: 72%
Conserved: 57%
Enriched Motifs & Matches
Match Detail: [Jaspar]
|
| ||
|---|---|---|
| Sites: 94/100 | e-val: 0.0000000000000097 | ||
| Factor | e-val(match) | DB |
| SP1 | 0.0000070702 | JASPAR |
| TFAP2A | 0.00014576 | JASPAR |
| Egr1 | 0.007148 | JASPAR |
| Klf4 | 0.042845 | JASPAR |
| INSM1 | 0.11628 | JASPAR |
BED file downloads
Top 10 Example Regions
| Location | Gene Link | Dist. |
|---|---|---|
| chr1: 156630205-156630355 | RP11-284F21.7 | 52.37 |
| chr10: 29698400-29698550 | PTCHD3P1 | 53.35 |
| chrX: 73513340-73513490 | FTX | 55.89 |
| chr7: 44622280-44622430 | NPC1L1 | 66.44 |
| chr20: 2489520-2489670 | ZNF343 | 68.7 |
| chr20: 2489520-2489670 | SNRPB | 68.7 |
| chr20: 2489520-2489670 | RP4-734P14.4 | 68.7 |
| chr17: 58677020-58677170 | RN7SL606P | 68.78 |
| chr17: 58677020-58677170 | PPM1D | 68.78 |
| chr3: 160472820-160472970 | ARL14 | 71.8 |