SOM cluster: 1361
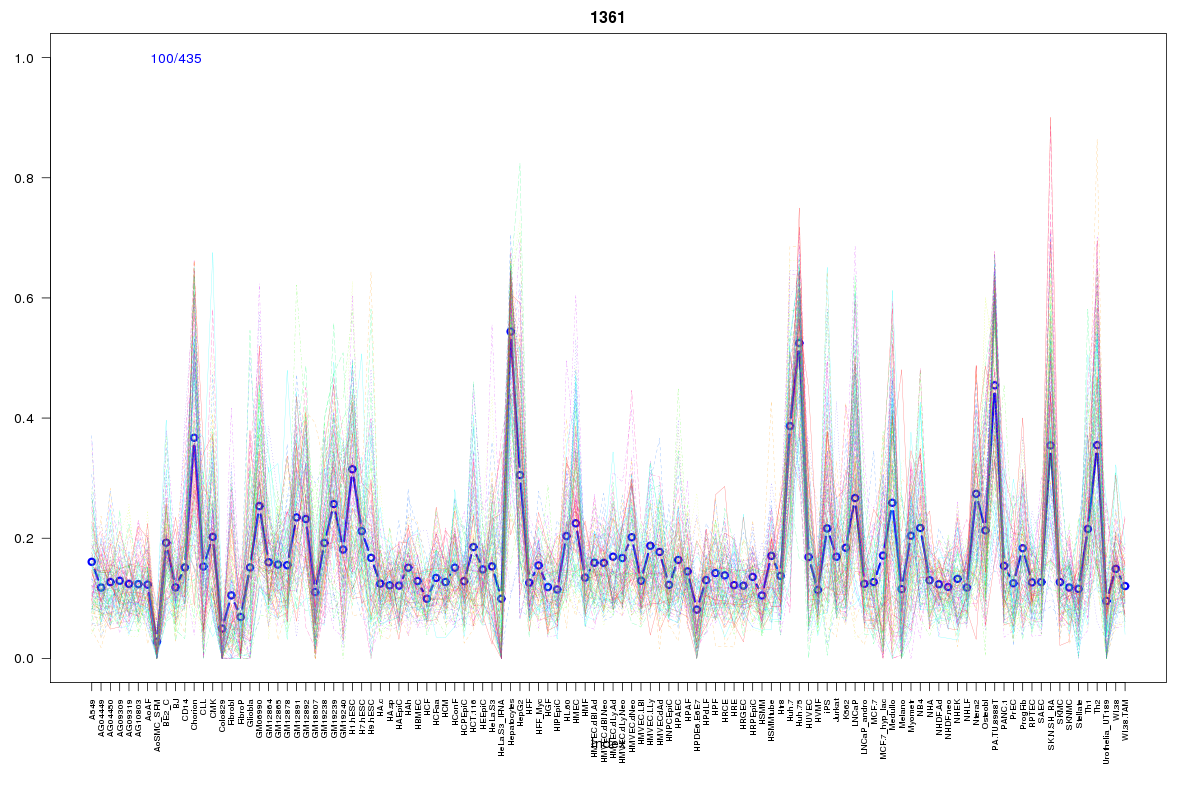
Cluster Hypersensitivity Profile

Genomic Location Trend
These plots show the distribution of the DHS sites surrounding the Transcript Start Site of the nearest gene.
Stats
Number of sites: 435Promoter: 31%
CpG-Island: 54%
Conserved: 37%
Enriched Motifs & Matches
Match Detail: [Jaspar]
|
| ||
|---|---|---|
| Sites: 99/100 | e-val: 8.40779e-45 | ||
| Factor | e-val(match) | DB |
| SP1 | 0.000018649 | JASPAR |
| TFAP2A | 0.0011812 | JASPAR |
| Zfx | 0.0021771 | JASPAR |
| PLAG1 | 0.014033 | JASPAR |
| Klf4 | 0.018081 | JASPAR |
|
| ||
| Sites: 89/100 | e-val: 5.5e-32 | ||
| Factor | e-val(match) | DB |
| SP1 | 0.000000003725 | JASPAR |
| TFAP2A | 0.0016627 | JASPAR |
| Klf4 | 0.0019644 | JASPAR |
| MIZF | 0.010973 | JASPAR |
| Stat3 | 0.011851 | JASPAR |
|
| ||
| Sites: 37/100 | e-val: 0.00087 | ||
| Factor | e-val(match) | DB |
| SP1 | 0.00000000066045 | JASPAR |
| TFAP2A | 0.000082253 | JASPAR |
| TP53 | 0.0013169 | JASPAR |
| Klf4 | 0.0013463 | JASPAR |
| MZF1_1-4 | 0.0026486 | JASPAR |
BED file downloads
Top 10 Example Regions
| Location | Gene Link | Dist. |
|---|---|---|
| chr9: 139559705-139559855 | FAM69B | 34.99 |
| chr9: 139559705-139559855 | MIR126 | 34.99 |
| chr11: 60691365-60691515 | CCDC86 | 46.37 |
| chr11: 60691365-60691515 | PRPF19 | 46.37 |
| chr11: 66057285-66057435 | YIF1A | 50.97 |
| chr11: 66057285-66057435 | BRMS1 | 50.97 |
| chr11: 66057285-66057435 | CD248 | 50.97 |
| chr8: 142317385-142317535 | SLC45A4 | 52.73 |
| chr2: 72374785-72374935 | CYP26B1 | 55.08 |
| chr19: 33716845-33716995 | SLC7A10 | 56.4 |