SOM cluster: 1390
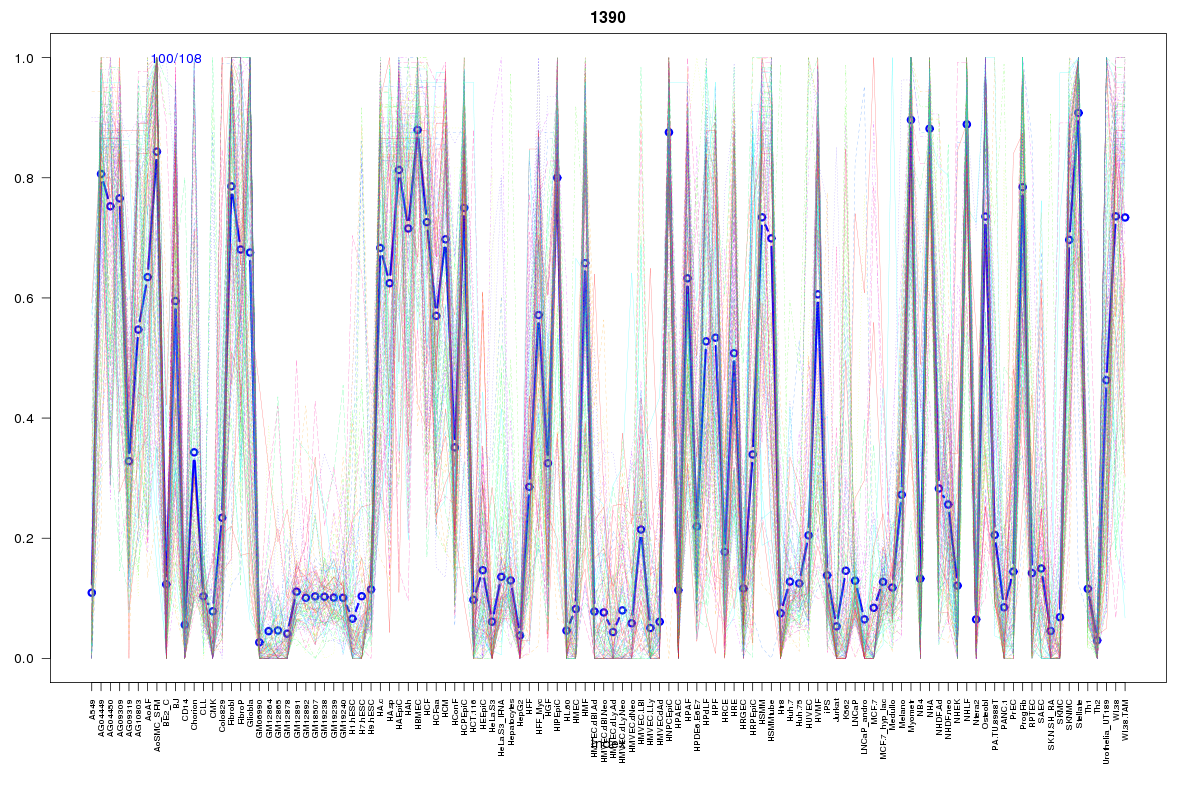
Cluster Hypersensitivity Profile

Genomic Location Trend
These plots show the distribution of the DHS sites surrounding the Transcript Start Site of the nearest gene.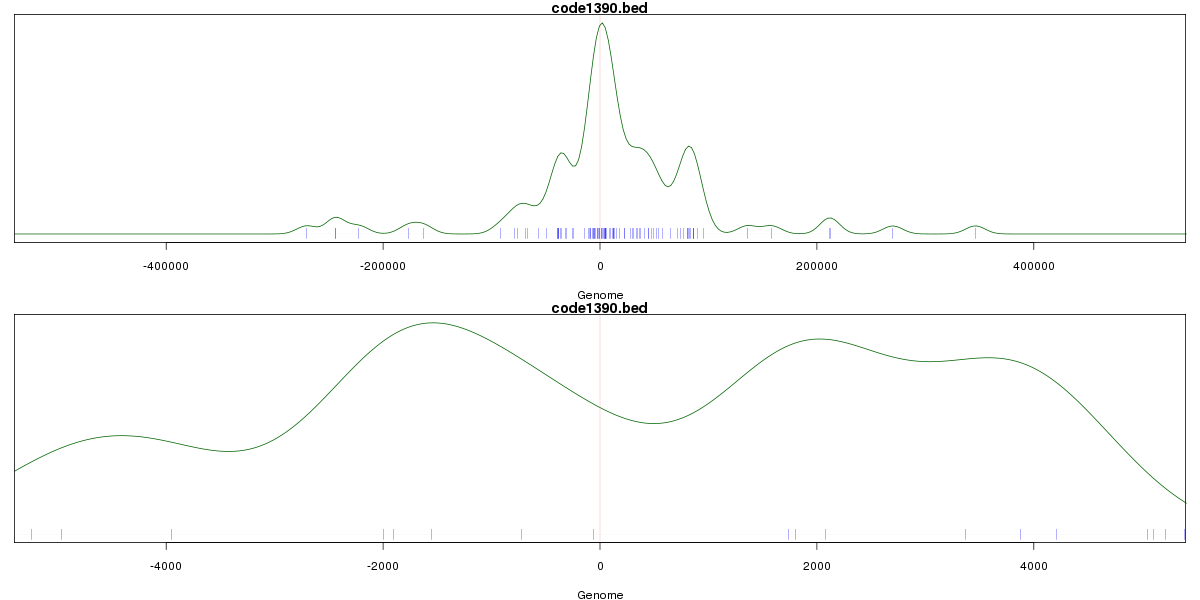
Stats
Number of sites: 108Promoter: 6%
CpG-Island: 1%
Conserved: 28%
Enriched Motifs & Matches
Match Detail: [Jaspar]
|
| ||
|---|---|---|
| Sites: 23/100 | e-val: 0.000032 | ||
| Factor | e-val(match) | DB |
| AP1 | 0.000000000025742 | JASPAR |
| NFE2L2 | 0.0000000068398 | JASPAR |
| PPARG | 0.0025385 | JASPAR |
| NFE2L1::MafG | 0.0047519 | JASPAR |
| RORA_2 | 0.013255 | JASPAR |
BED file downloads
Top 10 Example Regions
| Location | Gene Link | Dist. |
|---|---|---|
| chr7: 130129060-130129210 | MEST | 44.32 |
| chr3: 8602420-8602570 | LMCD1 | 52.47 |
| chr3: 8602420-8602570 | LINC00312 | 52.47 |
| chr7: 47541140-47541290 | TNS3 | 54.54 |
| chr18: 46117160-46117310 | CTIF | 57.42 |
| chr7: 55376020-55376170 | EGFR | 57.43 |
| chr2: 217639440-217639590 | IGFBP5 | 60.49 |
| chr2: 217639440-217639590 | AC007557.1 | 60.49 |
| chr2: 217639440-217639590 | AC007563.5 | 60.49 |
| chr6: 31111080-31111230 | HCG27 | 63.59 |