SOM cluster: 1394
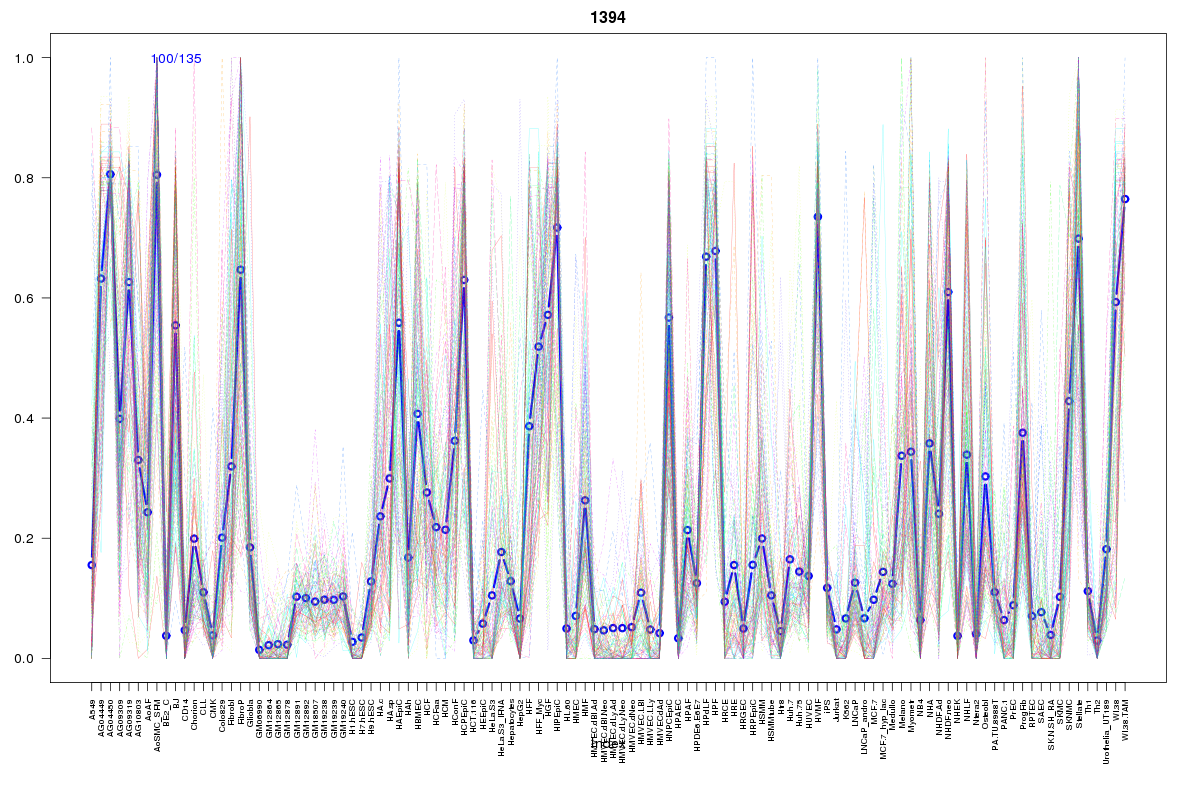
Cluster Hypersensitivity Profile

Genomic Location Trend
These plots show the distribution of the DHS sites surrounding the Transcript Start Site of the nearest gene.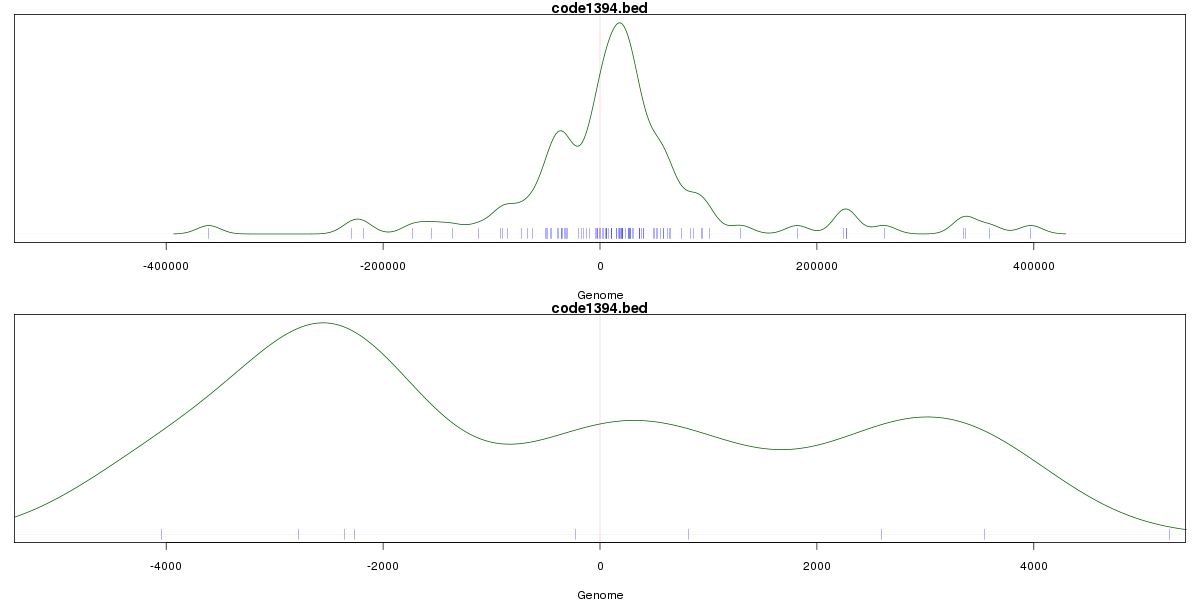
Stats
Number of sites: 135Promoter: 1%
CpG-Island: 0%
Conserved: 41%
Enriched Motifs & Matches
Match Detail: [Jaspar]
|
| ||
|---|---|---|
| Sites: 50/100 | e-val: 1.5e-19 | ||
| Factor | e-val(match) | DB |
| Foxa2 | 0.000000012856 | JASPAR |
| FOXA1 | 0.000000048753 | JASPAR |
| FOXI1 | 0.00000030113 | JASPAR |
| Foxq1 | 0.00000083522 | JASPAR |
| Foxd3 | 0.0000045651 | JASPAR |
|
| ||
| Sites: 23/100 | e-val: 0.00012 | ||
| Factor | e-val(match) | DB |
| EWSR1-FLI1 | 0.0000099328 | JASPAR |
| Foxd3 | 0.0020939 | JASPAR |
| FOXA1 | 0.0039156 | JASPAR |
| SOX10 | 0.0094459 | JASPAR |
| IRF1 | 0.0096577 | JASPAR |
BED file downloads
Top 10 Example Regions
| Location | Gene Link | Dist. |
|---|---|---|
| chr8: 41043120-41043270 | SFRP1 | 41.78 |
| chr5: 64595780-64595930 | ADAMTS6 | 44.14 |
| chr1: 192733020-192733170 | RGS2 | 48.93 |
| chr1: 33856340-33856490 | RP11-415J8.5 | 57.5 |
| chr1: 33856340-33856490 | AL513327.1 | 57.5 |
| chr1: 33856340-33856490 | ZSCAN20 | 57.5 |
| chr2: 208422920-208423070 | CREB1 | 59.39 |
| chr12: 10337180-10337330 | CLEC1A | 60.93 |
| chr12: 10337180-10337330 | OLR1 | 60.93 |
| chr12: 10337180-10337330 | HNRNPABP1 | 60.93 |