SOM cluster: 141
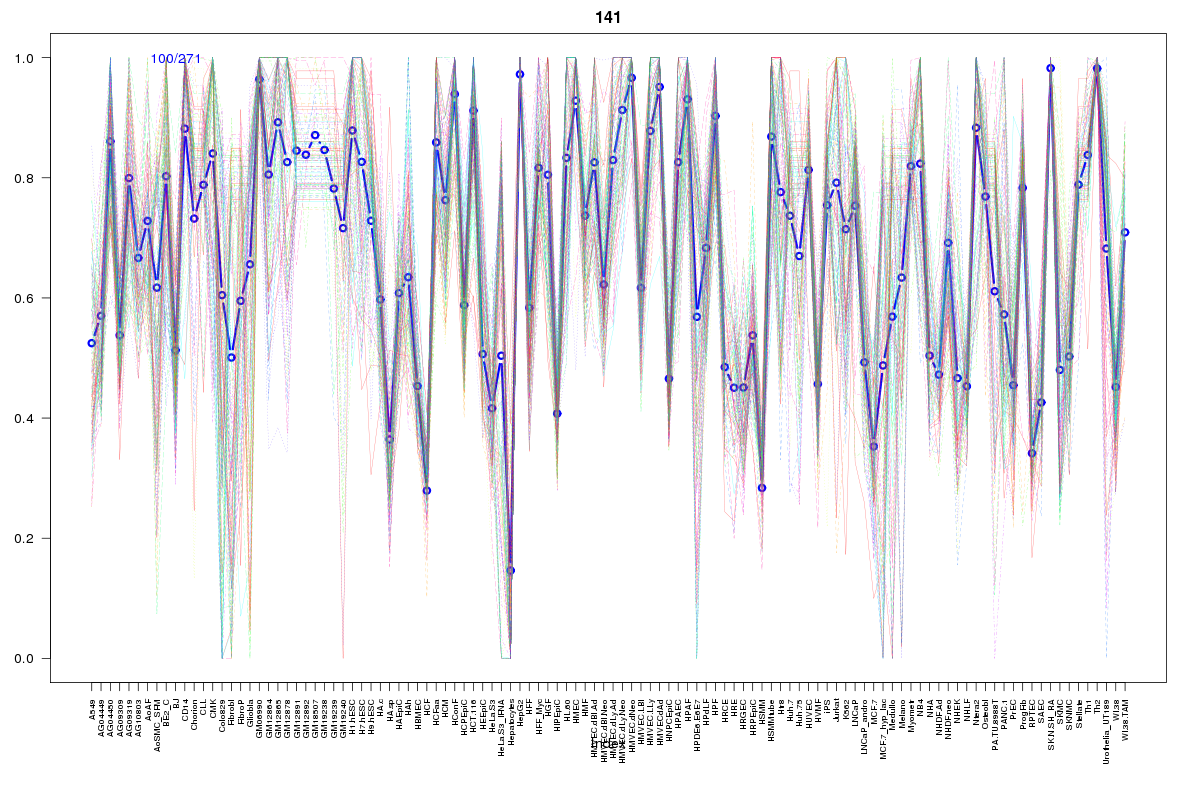
Cluster Hypersensitivity Profile

Genomic Location Trend
These plots show the distribution of the DHS sites surrounding the Transcript Start Site of the nearest gene.
Stats
Number of sites: 271Promoter: 76%
CpG-Island: 99%
Conserved: 89%
Enriched Motifs & Matches
Match Detail: [Jaspar]
|
| ||
|---|---|---|
| Sites: 98/100 | e-val: 0 | ||
| Factor | e-val(match) | DB |
| SP1 | 0.000001662 | JASPAR |
| TFAP2A | 0.00012437 | JASPAR |
| Egr1 | 0.00071218 | JASPAR |
| PLAG1 | 0.0022159 | JASPAR |
| INSM1 | 0.043164 | JASPAR |
|
| ||
| Sites: 95/100 | e-val: 0 | ||
| Factor | e-val(match) | DB |
| SP1 | 0.00000056377 | JASPAR |
| TFAP2A | 0.0014941 | JASPAR |
| Egr1 | 0.0018982 | JASPAR |
| Zfx | 0.019789 | JASPAR |
| Klf4 | 0.023819 | JASPAR |
|
| ||
| Sites: 66/100 | e-val: 1.1 | ||
| Factor | e-val(match) | DB |
| SP1 | 0.0000013373 | JASPAR |
| Klf4 | 0.0038522 | JASPAR |
| Egr1 | 0.0042173 | JASPAR |
| TFAP2A | 0.0081502 | JASPAR |
| PLAG1 | 0.092863 | JASPAR |
BED file downloads
Top 10 Example Regions
| Location | Gene Link | Dist. |
|---|---|---|
| chr7: 139762720-139762870 | PARP12 | 42.43 |
| chr9: 37800720-37800870 | DCAF10 | 42.79 |
| chr6: 127587900-127588050 | RSPO3 | 47.2 |
| chr8: 80680020-80680170 | HEY1 | 51.22 |
| chr11: 33278760-33278910 | RPL29P23 | 54.92 |
| chr1: 171711180-171711330 | MYOC | 54.95 |
| chr9: 130889980-130890130 | LCN2 | 56.04 |
| chr1: 244998320-244998470 | HNRNPU-AS1 | 57.15 |
| chr6: 2989240-2989390 | RP1-90J20.8 | 63.31 |
| chr6: 2989240-2989390 | SERPINB8P1 | 63.31 |