SOM cluster: 1415
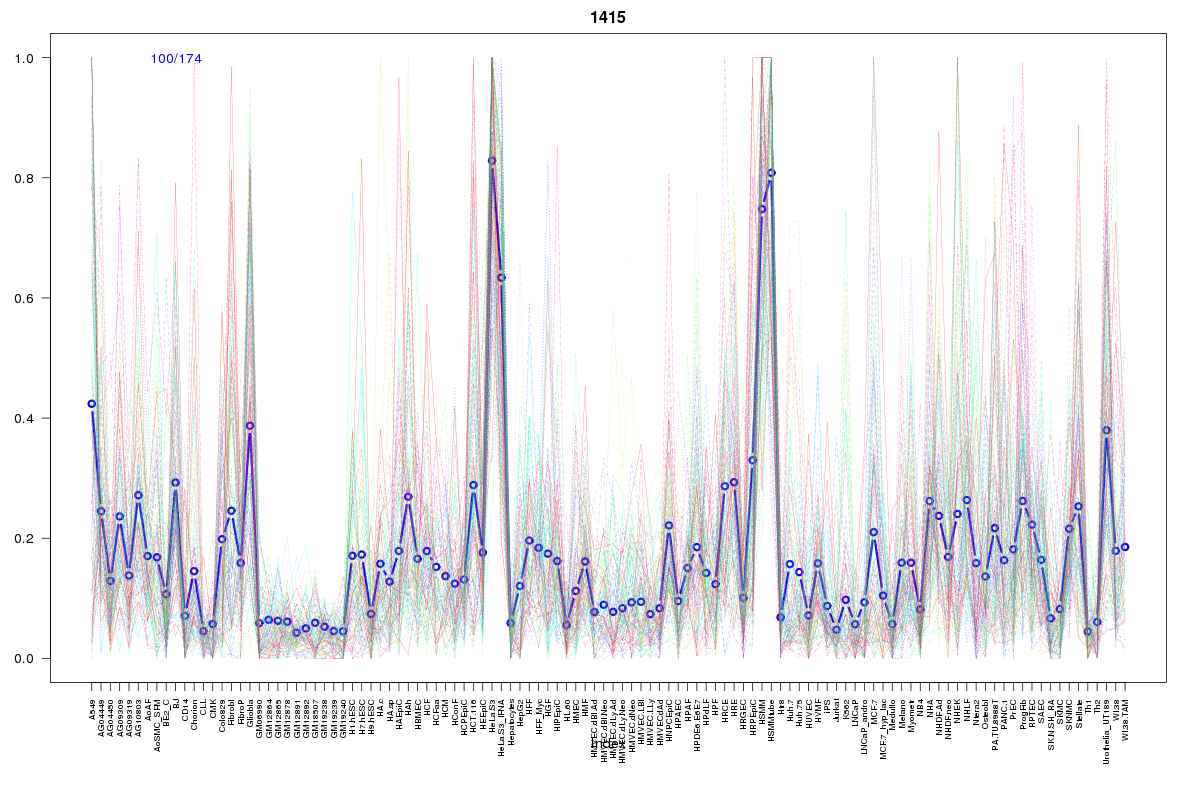
Cluster Hypersensitivity Profile

Genomic Location Trend
These plots show the distribution of the DHS sites surrounding the Transcript Start Site of the nearest gene.
Stats
Number of sites: 174Promoter: 1%
CpG-Island: 0%
Conserved: 35%
Enriched Motifs & Matches
Match Detail: [Jaspar]
|
| ||
|---|---|---|
| Sites: 19/100 | e-val: 0.00029 | ||
| Factor | e-val(match) | DB |
| Klf4 | 0.000072687 | JASPAR |
| SP1 | 0.00052479 | JASPAR |
| Tcfcp2l1 | 0.011382 | JASPAR |
| TP53 | 0.011423 | JASPAR |
| RREB1 | 0.013451 | JASPAR |
|
| ||
| Sites: 14/100 | e-val: 0.0044 | ||
| Factor | e-val(match) | DB |
| znf143 | 0.000015938 | JASPAR |
| TEAD1 | 0.00039761 | JASPAR |
| REL | 0.001644 | JASPAR |
| EWSR1-FLI1 | 0.0016847 | JASPAR |
| NFATC2 | 0.0019637 | JASPAR |
BED file downloads
Top 10 Example Regions
| Location | Gene Link | Dist. |
|---|---|---|
| chr11: 66701100-66701250 | SYT12 | 36.27 |
| chr11: 66701100-66701250 | C11orf86 | 36.27 |
| chr11: 66701100-66701250 | PC | 36.27 |
| chr3: 194258480-194258630 | ATP13A3 | 37.2 |
| chr3: 194258480-194258630 | LINC00884 | 37.2 |
| chr9: 130861560-130861710 | SLC25A25 | 59.18 |
| chr8: 102063625-102063775 | RN7SKP249 | 62.93 |
| chr9: 132512320-132512470 | AL590369.1 | 65.23 |
| chr9: 132512320-132512470 | TOR1B | 65.23 |
| chr9: 132512320-132512470 | PTGES | 65.23 |