SOM cluster: 1419
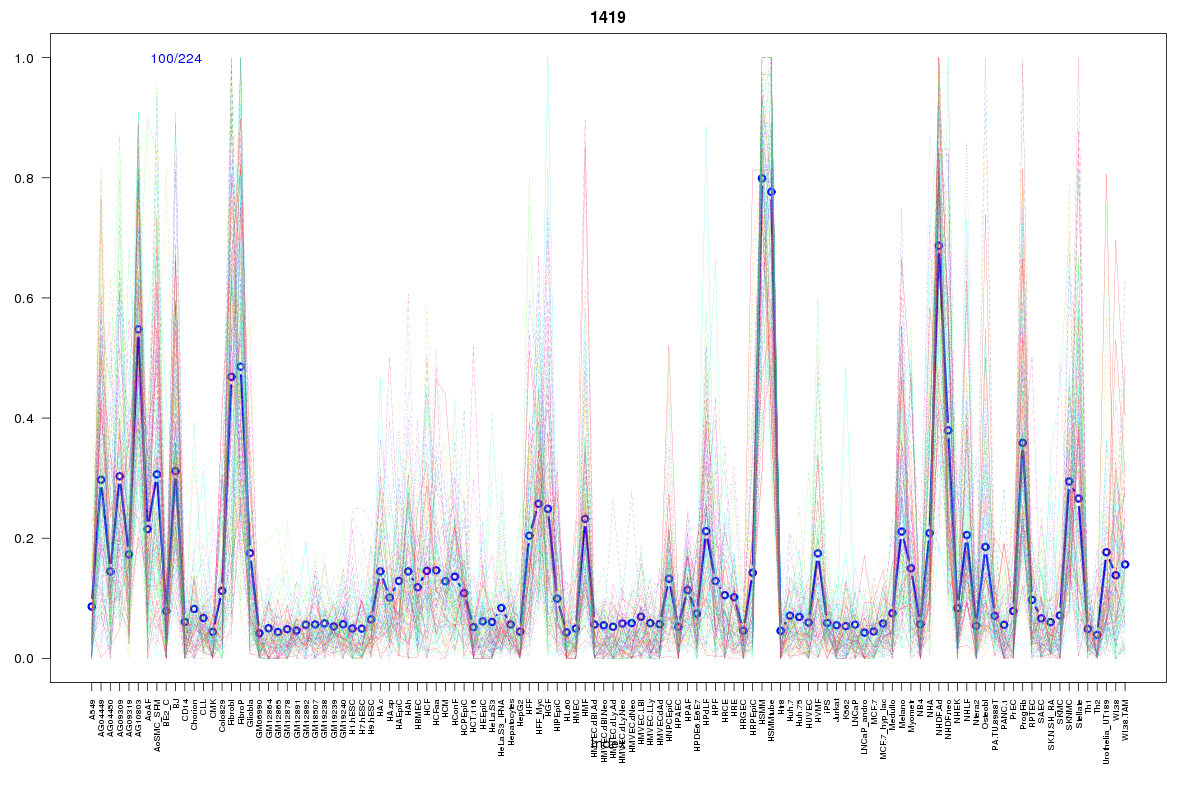
Cluster Hypersensitivity Profile

Genomic Location Trend
These plots show the distribution of the DHS sites surrounding the Transcript Start Site of the nearest gene.
Stats
Number of sites: 224Promoter: 2%
CpG-Island: 0%
Conserved: 46%
Enriched Motifs & Matches
Match Detail: [Jaspar]
|
| ||
|---|---|---|
| Sites: 21/100 | e-val: 0.013 | ||
| Factor | e-val(match) | DB |
| REST | 0.0008232 | JASPAR |
| TAL1::TCF3 | 0.0020906 | JASPAR |
| Myf | 0.0021785 | JASPAR |
| NHLH1 | 0.0046823 | JASPAR |
| NFE2L2 | 0.0089577 | JASPAR |
BED file downloads
Top 10 Example Regions
| Location | Gene Link | Dist. |
|---|---|---|
| chr12: 54466280-54466430 | RP11-834C11.4 | 48.65 |
| chr11: 68803540-68803690 | MRGPRF | 50.53 |
| chr11: 68803540-68803690 | RP11-554A11.6 | 50.53 |
| chr11: 68803540-68803690 | TPCN2 | 50.53 |
| chr1: 203265720-203265870 | FMOD | 51.94 |
| chr1: 203265720-203265870 | RP11-134P9.3 | 51.94 |
| chr18: 8799980-8800130 | SOGA2 | 55.43 |
| chr4: 8257820-8257970 | RP11-774O3.3 | 58.89 |
| chr4: 8257820-8257970 | SH3TC1 | 58.89 |
| chr4: 8257820-8257970 | HTRA3 | 58.89 |