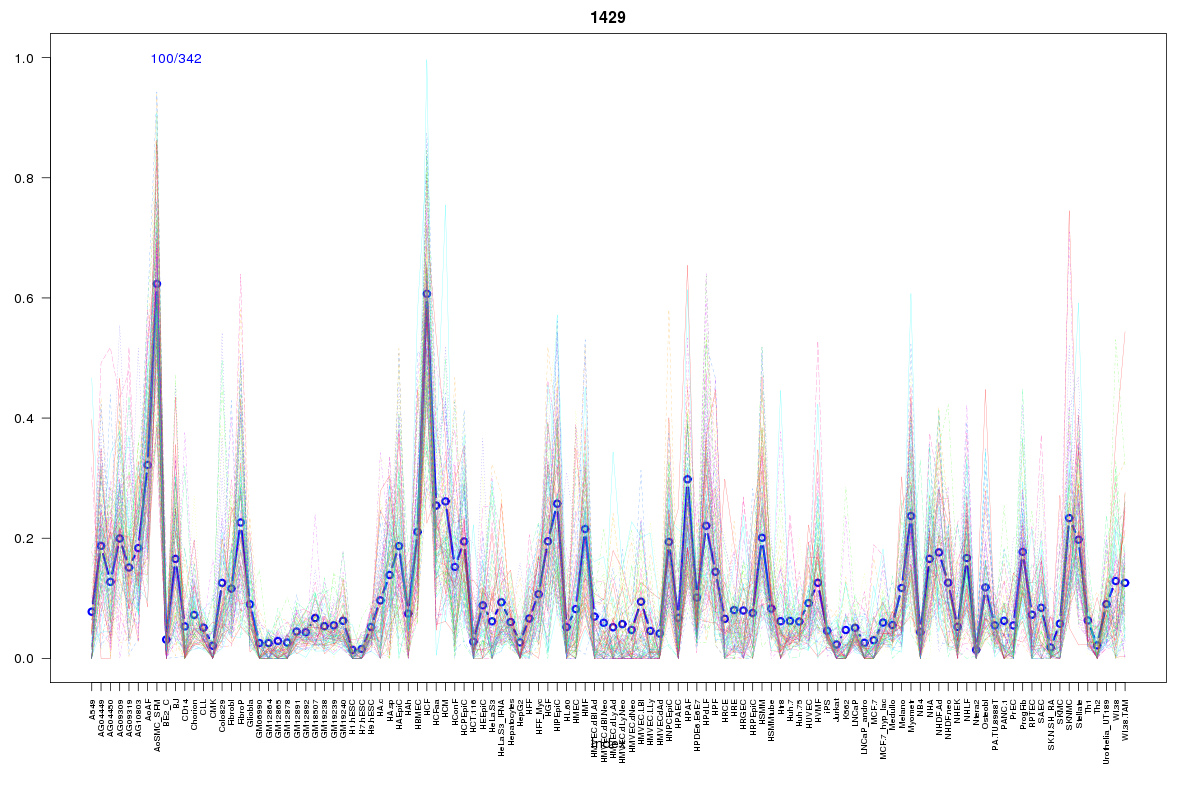
SOM cluster: 1429
Cluster Hypersensitivity Profile

Genomic Location Trend
These plots show the distribution of the DHS sites surrounding the Transcript Start Site of the nearest gene.
Stats
Number of sites: 342Promoter: 1%
CpG-Island: 0%
Conserved: 30%
Enriched Motifs & Matches
Match Detail: [Jaspar]
|
| ||
|---|---|---|
| Sites: 47/100 | e-val: 0.00000000000081 | ||
| Factor | e-val(match) | DB |
| Foxd3 | 0.00000027449 | JASPAR |
| Foxq1 | 0.0017824 | JASPAR |
| ARID3A | 0.0020093 | JASPAR |
| FOXA1 | 0.004589 | JASPAR |
| Foxa2 | 0.0088465 | JASPAR |
BED file downloads
Top 10 Example Regions
| Location | Gene Link | Dist. |
|---|---|---|
| chr1: 66747900-66748050 | PDE4B | 36.31 |
| chr3: 30269800-30269950 | U3 | 37.27 |
| chr9: 109690340-109690490 | RP11-508N12.3 | 41.04 |
| chr14: 59948780-59948930 | GPR135 | 44.06 |
| chr14: 59948780-59948930 | JKAMP | 44.06 |
| chr14: 59948780-59948930 | L3HYPDH | 44.06 |
| chr2: 48118560-48118710 | AC079807.3 | 44.82 |
| chr3: 29735325-29735475 | RBMS3 | 52.34 |
| chr12: 117434600-117434750 | FBXW8 | 55.24 |
| chr1: 145115080-145115230 | PDE4DIP | 66.28 |