SOM cluster: 1430
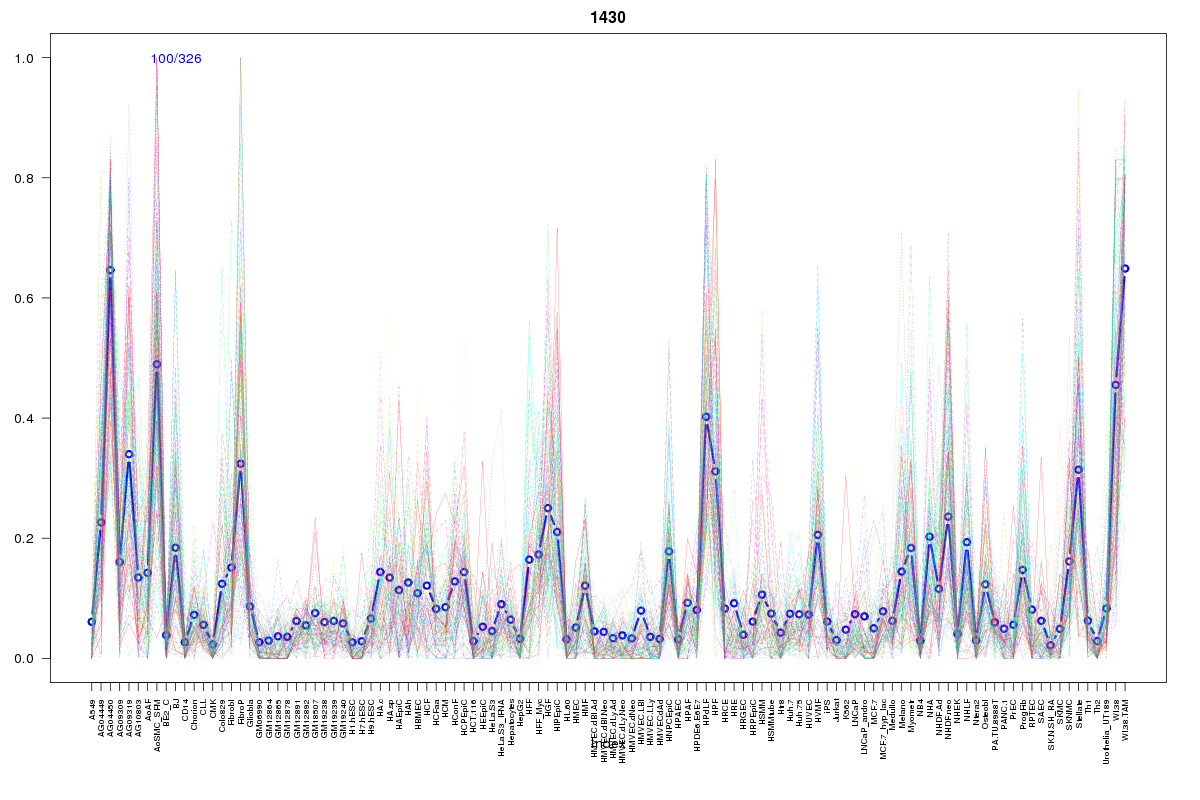
Cluster Hypersensitivity Profile

Genomic Location Trend
These plots show the distribution of the DHS sites surrounding the Transcript Start Site of the nearest gene.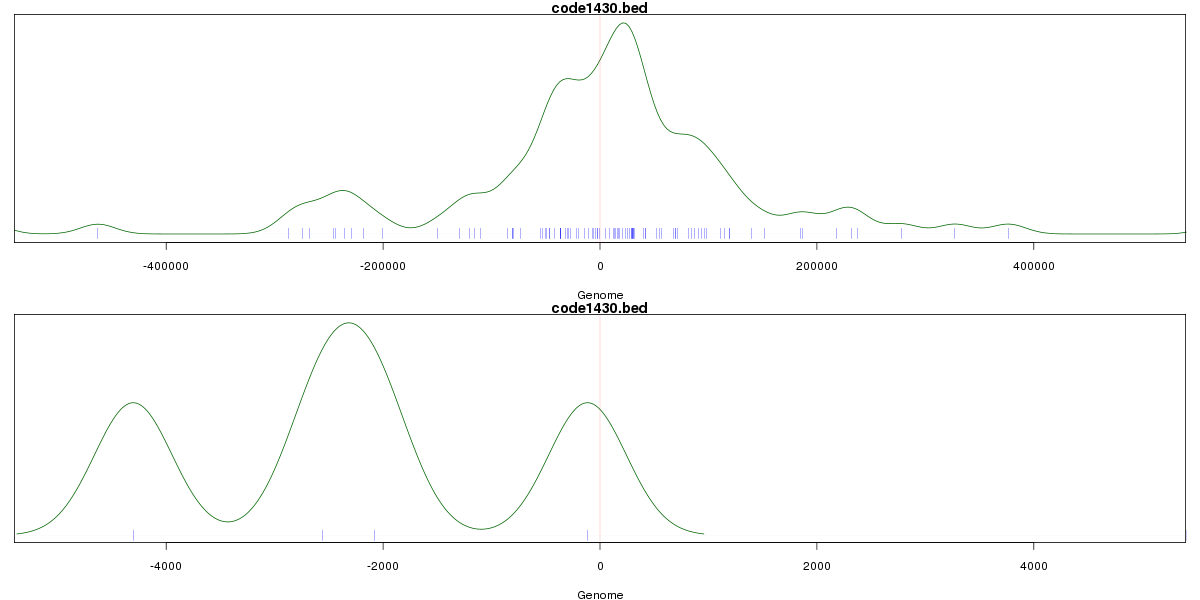
Stats
Number of sites: 326Promoter: 1%
CpG-Island: 0%
Conserved: 38%
Enriched Motifs & Matches
Match Detail: [Jaspar]
|
| ||
|---|---|---|
| Sites: 45/100 | e-val: 1.1e-21 | ||
| Factor | e-val(match) | DB |
| Foxq1 | 0.000000000092412 | JASPAR |
| Foxd3 | 0.0000000079945 | JASPAR |
| FOXI1 | 0.000000018535 | JASPAR |
| Foxa2 | 0.000000020304 | JASPAR |
| FOXA1 | 0.000000025991 | JASPAR |
BED file downloads
Top 10 Example Regions
| Location | Gene Link | Dist. |
|---|---|---|
| chr9: 115609200-115609350 | SNX30 | 36.01 |
| chr2: 25116960-25117110 | ADCY3 | 43.08 |
| chr12: 27940620-27940770 | MRPS35 | 47.53 |
| chr7: 47702040-47702190 | TNS3 | 49.21 |
| chr7: 45909120-45909270 | IGFBP3 | 50.53 |
| chr8: 13226080-13226230 | DLC1 | 52.3 |
| chr1: 67084160-67084310 | SGIP1 | 54.31 |
| chr12: 91576920-91577070 | LUM | 55.04 |
| chr12: 91576920-91577070 | DCN | 55.04 |
| chr7: 43289160-43289310 | HECW1 | 56.65 |