SOM cluster: 1431
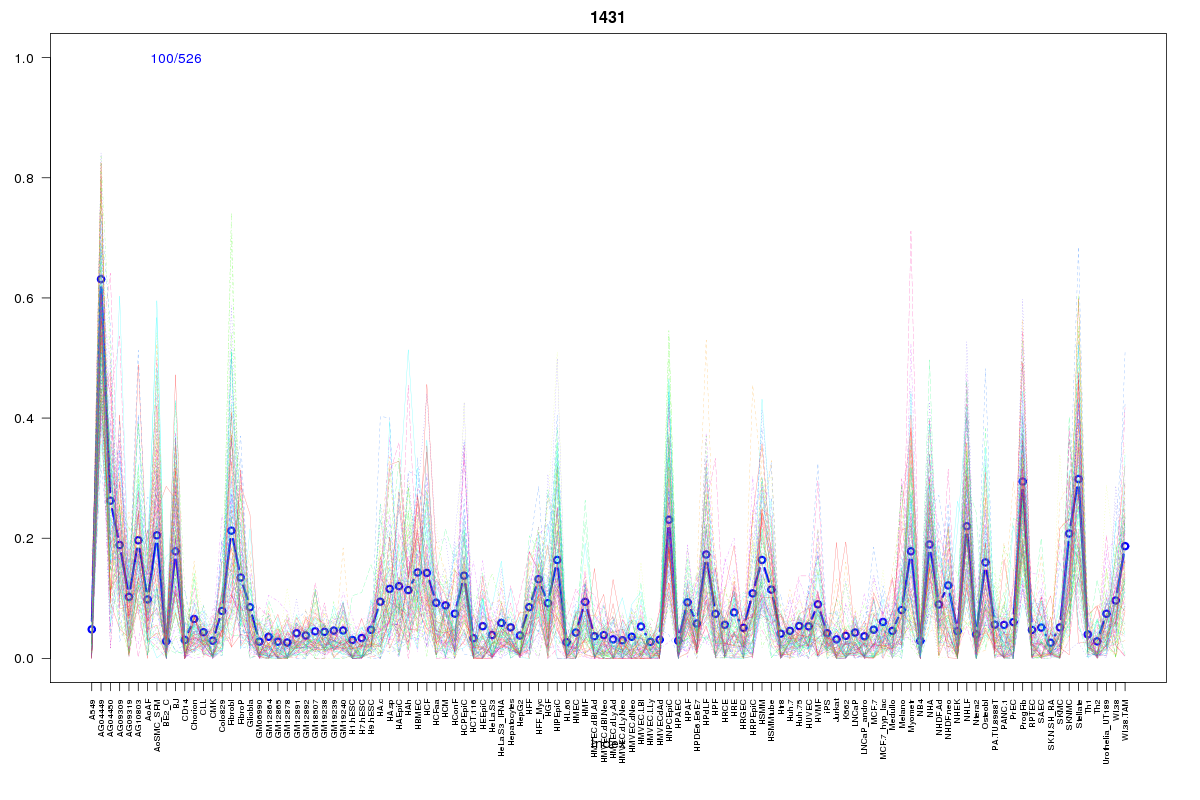
Cluster Hypersensitivity Profile

Genomic Location Trend
These plots show the distribution of the DHS sites surrounding the Transcript Start Site of the nearest gene.
Stats
Number of sites: 526Promoter: 1%
CpG-Island: 0%
Conserved: 26%
Enriched Motifs & Matches
Match Detail: [Jaspar]
|
| ||
|---|---|---|
| Sites: 43/100 | e-val: 8e-17 | ||
| Factor | e-val(match) | DB |
| HNF1A | 0.00055886 | JASPAR |
| MEF2A | 0.00061369 | JASPAR |
| Foxq1 | 0.003382 | JASPAR |
| NKX3-1 | 0.0045117 | JASPAR |
| Prrx2 | 0.018494 | JASPAR |
BED file downloads
Top 10 Example Regions
| Location | Gene Link | Dist. |
|---|---|---|
| chr1: 150554940-150555090 | TARS2 | 17.38 |
| chr1: 150554940-150555090 | ENSA | 17.38 |
| chr1: 150554940-150555090 | ECM1 | 17.38 |
| chr7: 39950000-39950150 | CDK13 | 44.59 |
| chr12: 95874120-95874270 | RP11-167N24.5 | 49.28 |
| chr22: 48975460-48975610 | FAM19A5 | 51.08 |
| chr8: 83507080-83507230 | RP11-653B10.1 | 51.81 |
| chr2: 62824345-62824495 | EHBP1 | 52.69 |
| chr3: 150415585-150415735 | SIAH2-AS1 | 54.64 |
| chr1: 98413400-98413550 | MIR137HG | 56.45 |