SOM cluster: 1443
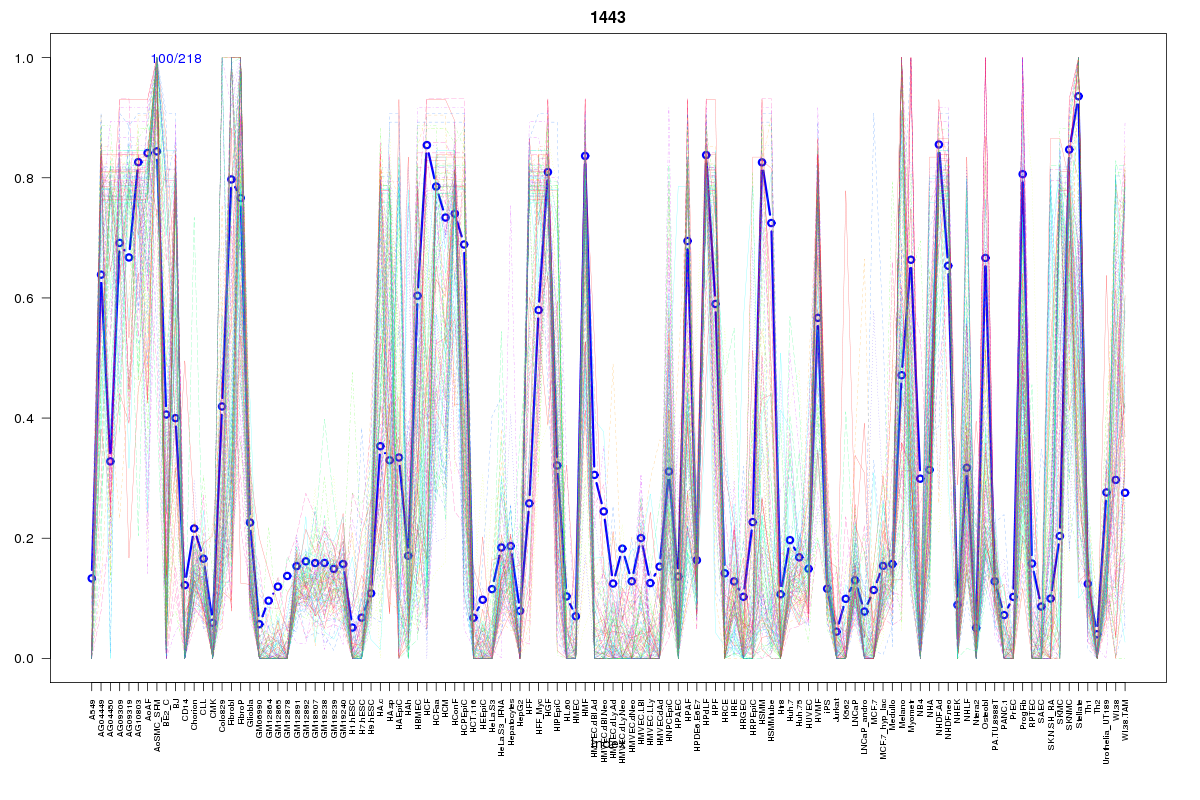
Cluster Hypersensitivity Profile

Genomic Location Trend
These plots show the distribution of the DHS sites surrounding the Transcript Start Site of the nearest gene.
Stats
Number of sites: 218Promoter: 3%
CpG-Island: 0%
Conserved: 84%
Enriched Motifs & Matches
Match Detail: [Jaspar]
|
| ||
|---|---|---|
| Sites: 55/100 | e-val: 0 | ||
| Factor | e-val(match) | DB |
| TAL1::TCF3 | 0.00000026245 | JASPAR |
| Prrx2 | 0.00020484 | JASPAR |
| ARID3A | 0.00023727 | JASPAR |
| Pdx1 | 0.001224 | JASPAR |
| HNF1A | 0.0014854 | JASPAR |
BED file downloads
Top 10 Example Regions
| Location | Gene Link | Dist. |
|---|---|---|
| chr8: 120591200-120591350 | ENPP2 | 44.04 |
| chr8: 120591200-120591350 | RP11-775B15.3 | 44.04 |
| chr1: 156771280-156771430 | CRABP2 | 46.29 |
| chr1: 156771280-156771430 | RRNAD1 | 46.29 |
| chr1: 156771280-156771430 | ISG20L2 | 46.29 |
| chr10: 33411040-33411190 | NRP1 | 47.02 |
| chr10: 33411040-33411190 | RP11-462L8.2 | 47.02 |
| chr8: 49817180-49817330 | SNAI2 | 49.55 |
| chr1: 172113800-172113950 | MIR214 | 50.61 |
| chr1: 172113800-172113950 | MIR199A2 | 50.61 |