SOM cluster: 1448
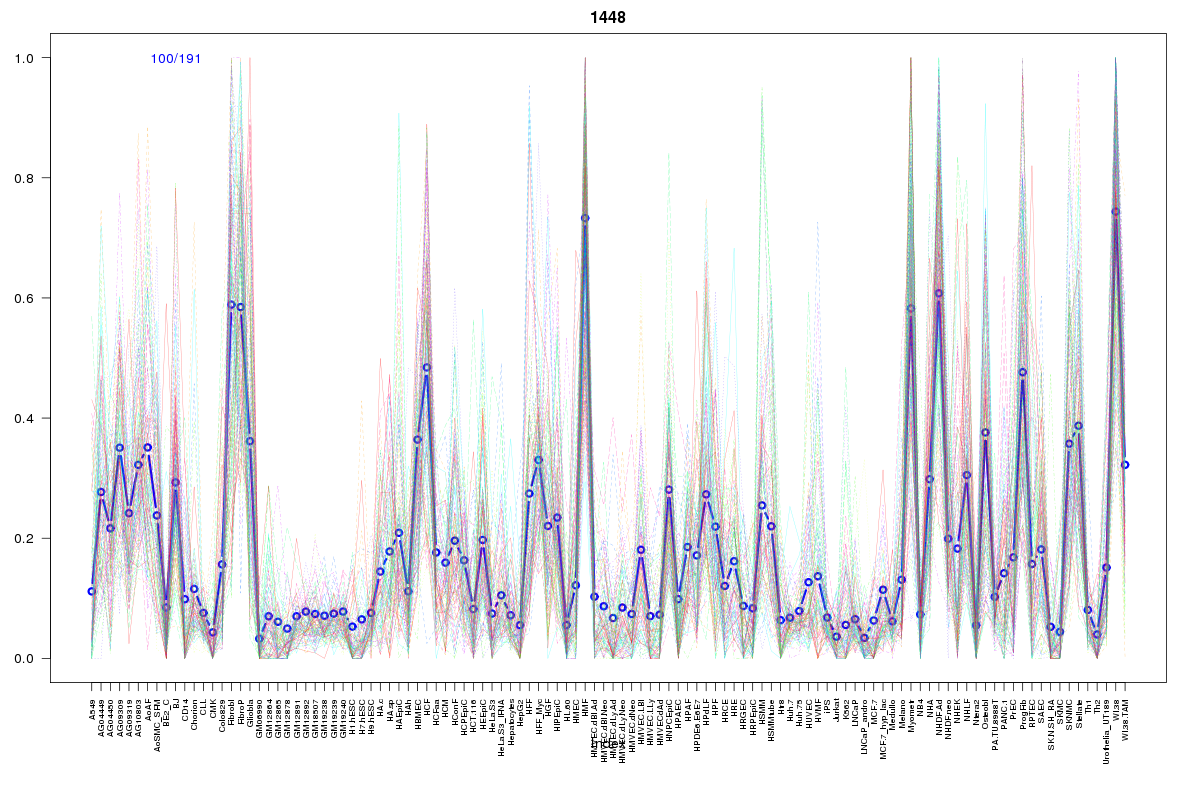
Cluster Hypersensitivity Profile

Genomic Location Trend
These plots show the distribution of the DHS sites surrounding the Transcript Start Site of the nearest gene.
Stats
Number of sites: 191Promoter: 2%
CpG-Island: 0%
Conserved: 22%
Enriched Motifs & Matches
Match Detail: [Jaspar]
|
| ||
|---|---|---|
| Sites: 51/100 | e-val: 1.9e-17 | ||
| Factor | e-val(match) | DB |
| AP1 | 0.000000000046624 | JASPAR |
| NFE2L2 | 0.0000000053463 | JASPAR |
| PPARG | 0.0039376 | JASPAR |
| NFE2L1::MafG | 0.0044716 | JASPAR |
| Foxa2 | 0.010425 | JASPAR |
BED file downloads
Top 10 Example Regions
| Location | Gene Link | Dist. |
|---|---|---|
| chr1: 161675980-161676130 | FCRLB | 39.17 |
| chr6: 35138100-35138250 | TCP11 | 54.82 |
| chr6: 35138100-35138250 | SCUBE3 | 54.82 |
| chr5: 112386585-112386735 | DCP2 | 59.88 |
| chr3: 197105080-197105230 | DLG1 | 61.61 |
| chr12: 115167660-115167810 | RP4-601P9.1 | 62.02 |
| chr12: 115167660-115167810 | TBX3 | 62.02 |
| chr19: 13271460-13271610 | CACNA1A | 65.27 |
| chr17: 59403060-59403210 | TBX2 | 66.29 |
| chr17: 59403060-59403210 | BCAS3 | 66.29 |