SOM cluster: 1464
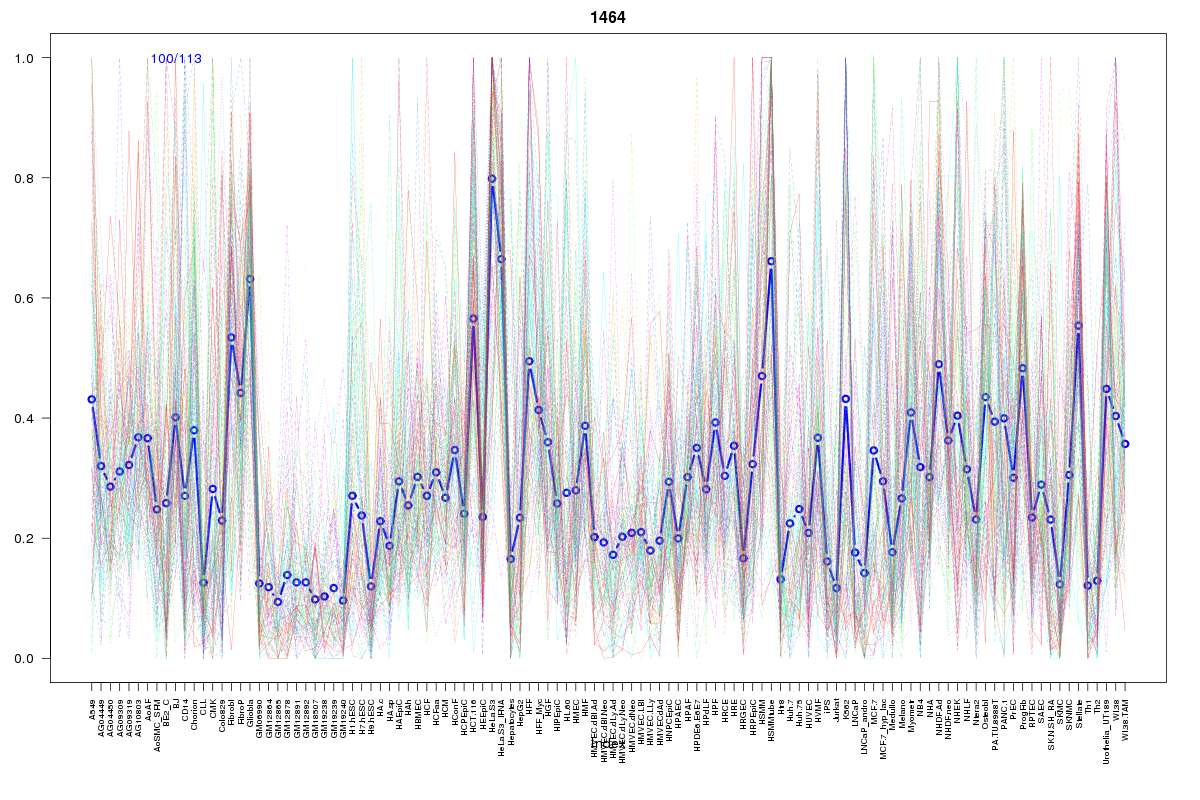
Cluster Hypersensitivity Profile

Genomic Location Trend
These plots show the distribution of the DHS sites surrounding the Transcript Start Site of the nearest gene.
Stats
Number of sites: 113Promoter: 14%
CpG-Island: 6%
Conserved: 47%
Enriched Motifs & Matches
Match Detail: [Jaspar]
|
| ||
|---|---|---|
| Sites: 40/100 | e-val: 6.2e-18 | ||
| Factor | e-val(match) | DB |
| NFE2L2 | 0.00000000013382 | JASPAR |
| AP1 | 0.000000022454 | JASPAR |
| PPARG | 0.00018289 | JASPAR |
| Pax2 | 0.00093571 | JASPAR |
| NFE2L1::MafG | 0.017346 | JASPAR |
|
| ||
| Sites: 31/100 | e-val: 0.000000082 | ||
| Factor | e-val(match) | DB |
| Klf4 | 0.000000025224 | JASPAR |
| SP1 | 0.00000044956 | JASPAR |
| Pax4 | 0.00000045314 | JASPAR |
| RREB1 | 0.000076244 | JASPAR |
| Egr1 | 0.00013651 | JASPAR |
BED file downloads
Top 10 Example Regions
| Location | Gene Link | Dist. |
|---|---|---|
| chr8: 96235780-96235930 | C8orf37 | 33.77 |
| chr8: 96235780-96235930 | KB-1047C11.2 | 33.77 |
| chr19: 13147640-13147790 | CALR | 43.01 |
| chr19: 13147640-13147790 | NFIX | 43.01 |
| chr19: 13147640-13147790 | LYL1 | 43.01 |
| chr19: 49061480-49061630 | FAM83E | 52.42 |
| chr19: 49061480-49061630 | LMTK3 | 52.42 |
| chr19: 49061480-49061630 | SEC1P | 52.42 |
| chr3: 159480180-159480330 | IQCJ-SCHIP1 | 53.37 |
| chr17: 43308220-43308370 | HEXIM1 | 54.82 |