SOM cluster: 1478
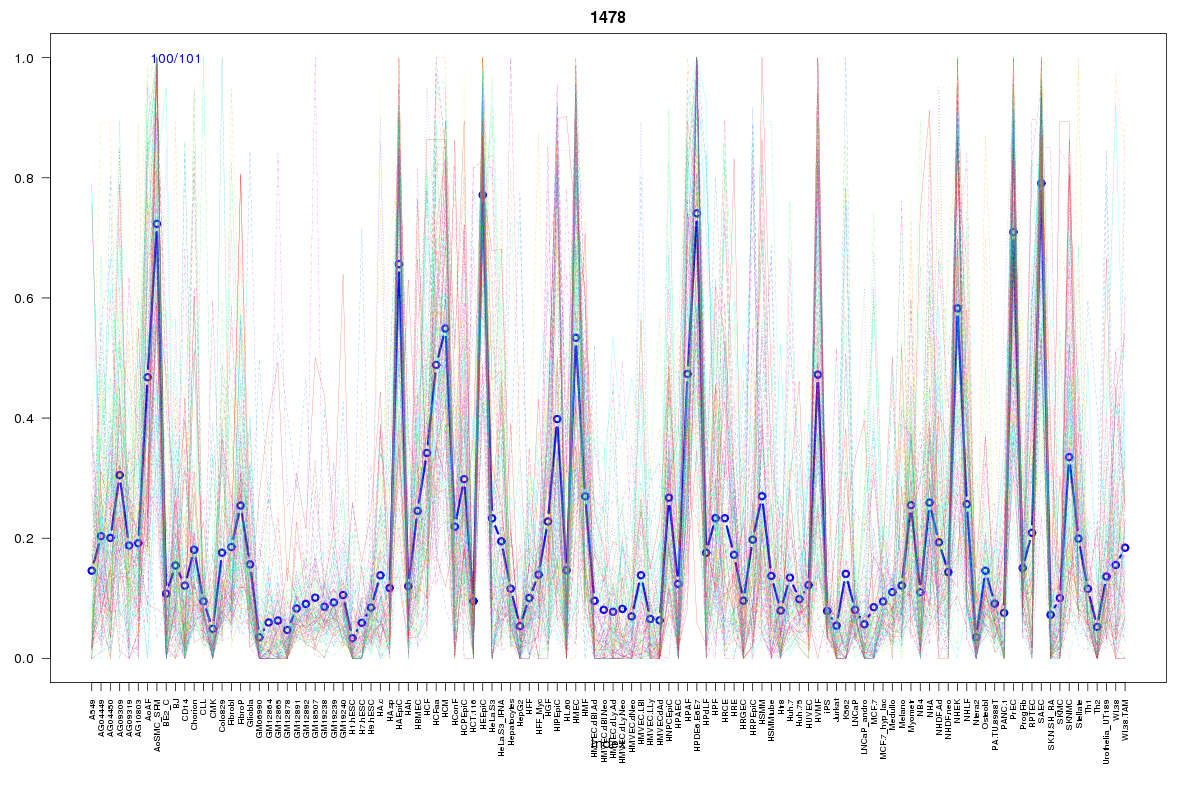
Cluster Hypersensitivity Profile

Genomic Location Trend
These plots show the distribution of the DHS sites surrounding the Transcript Start Site of the nearest gene.
Stats
Number of sites: 101Promoter: 4%
CpG-Island: 0%
Conserved: 32%
Enriched Motifs & Matches
Match Detail: [Jaspar]
|
| ||
|---|---|---|
| Sites: 20/100 | e-val: 0.0083 | ||
| Factor | e-val(match) | DB |
| TP53 | 0.0000000000000089928 | JASPAR |
| Tcfcp2l1 | 0.0000062928 | JASPAR |
| SRF | 0.00013976 | JASPAR |
| INSM1 | 0.0011919 | JASPAR |
| REL | 0.0068775 | JASPAR |
BED file downloads
Top 10 Example Regions
| Location | Gene Link | Dist. |
|---|---|---|
| chr19: 38812520-38812670 | KCNK6 | 33.69 |
| chr19: 38812520-38812670 | PPP1R14A | 33.69 |
| chr19: 38812520-38812670 | RASGRP4 | 33.69 |
| chr2: 29289280-29289430 | CLIP4 | 43.25 |
| chr3: 136703820-136703970 | IL20RB | 53.88 |
| chr8: 42123620-42123770 | RP11-231D20.2 | 54.35 |
| chr8: 54858300-54858450 | RP11-30L15.4 | 60.31 |
| chr8: 54858300-54858450 | RGS20 | 60.31 |
| chr12: 109089920-109090070 | RP11-689B22.2 | 64.26 |
| chr1: 59953160-59953310 | FGGY | 66.08 |