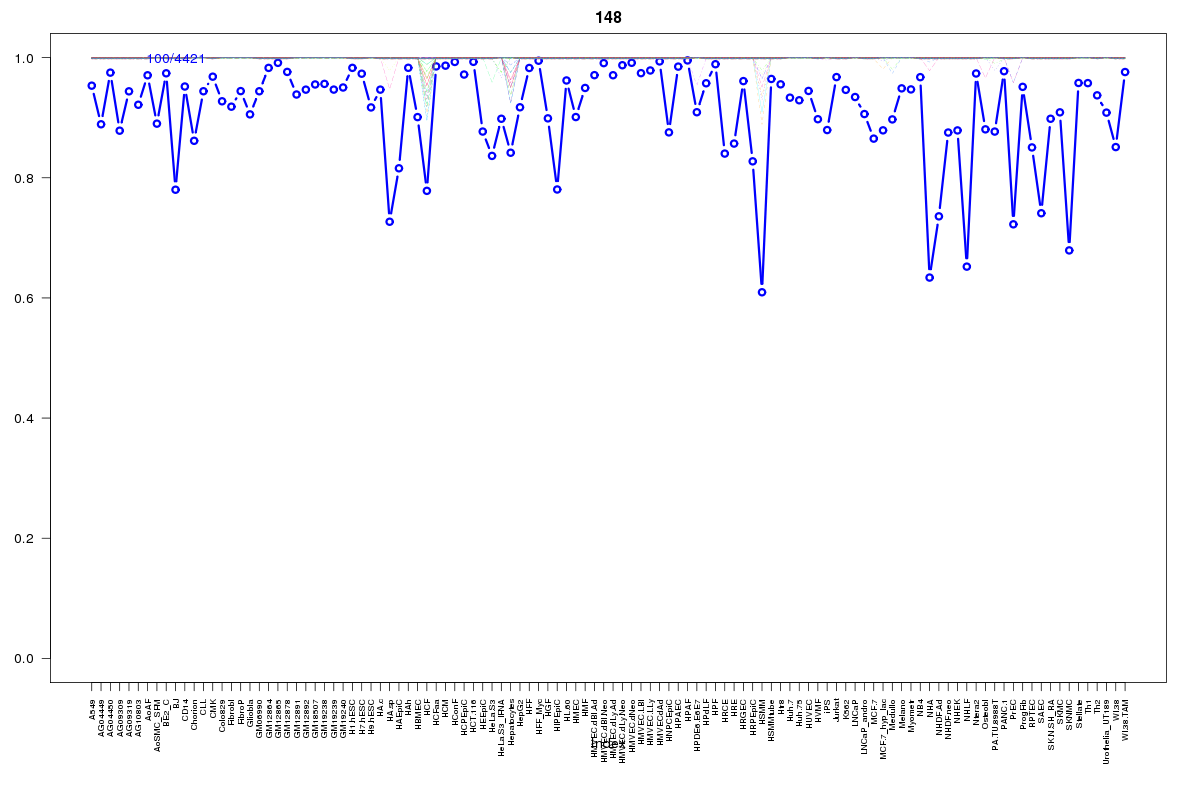
SOM cluster: 148
Cluster Hypersensitivity Profile

Genomic Location Trend
These plots show the distribution of the DHS sites surrounding the Transcript Start Site of the nearest gene.
Stats
Number of sites: 4421Promoter: 91%
CpG-Island: 94%
Conserved: 94%
Enriched Motifs & Matches
Match Detail: [Jaspar]
|
| ||
|---|---|---|
| Sites: 88/100 | e-val: 9.30462e-43 | ||
| Factor | e-val(match) | DB |
| Klf4 | 0.00000001121 | JASPAR |
| SP1 | 0.00000019351 | JASPAR |
| Zfx | 0.0026824 | JASPAR |
| Egr1 | 0.012532 | JASPAR |
| PLAG1 | 0.020016 | JASPAR |
|
| ||
| Sites: 47/100 | e-val: 5.1e-19 | ||
| Factor | e-val(match) | DB |
| NFYA | 0.000000087679 | JASPAR |
| NFIC | 0.00062698 | JASPAR |
| Pdx1 | 0.0068258 | JASPAR |
| PBX1 | 0.0074429 | JASPAR |
| E2F1 | 0.017731 | JASPAR |
|
| ||
| Sites: 19/100 | e-val: 0.000000028 | ||
| Factor | e-val(match) | DB |
| Egr1 | 0.00064171 | JASPAR |
| NHLH1 | 0.0020949 | JASPAR |
| CEBPA | 0.0081983 | JASPAR |
| E2F1 | 0.024346 | JASPAR |
| TP53 | 0.037265 | JASPAR |
BED file downloads
Top 10 Example Regions
| Location | Gene Link | Dist. |
|---|---|---|
| chr1: 150552060-150552210 | LINC00568 | 13.11 |
| chr1: 151254340-151254490 | PI4KB | 27.2 |
| chr1: 91966280-91966430 | RP11-47K11.2 | 27.22 |
| chr1: 151119140-151119290 | TMOD4 | 35.41 |
| chr1: 151119140-151119290 | GABPB2 | 35.41 |
| chr1: 151119140-151119290 | BNIPL | 35.41 |
| chr22: 21271500-21271650 | P2RX6 | 39.33 |
| chr19: 33668080-33668230 | WDR88 | 39.67 |
| chr5: 175815660-175815810 | RP11-844P9.3 | 40.44 |
| chr8: 95907880-95908030 | CCNE2 | 40.53 |