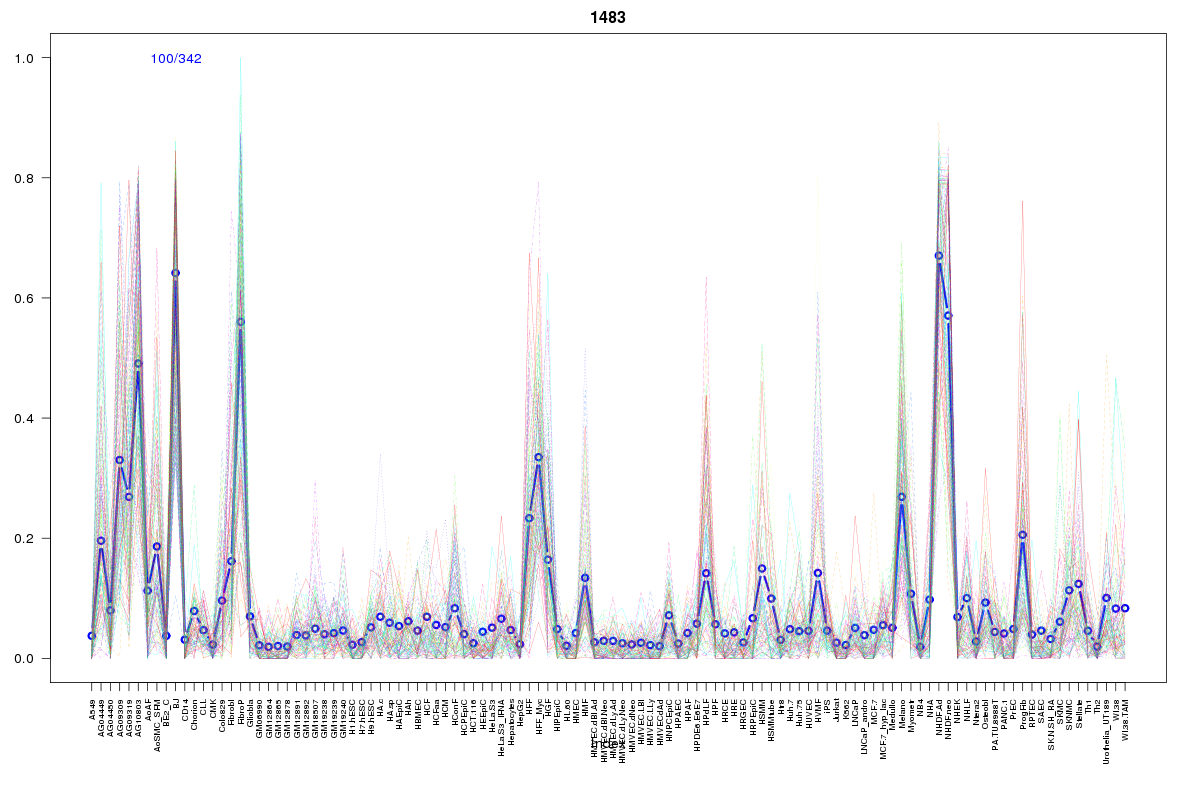
SOM cluster: 1483
Cluster Hypersensitivity Profile

Genomic Location Trend
These plots show the distribution of the DHS sites surrounding the Transcript Start Site of the nearest gene.
Stats
Number of sites: 342Promoter: 2%
CpG-Island: 0%
Conserved: 51%
Enriched Motifs & Matches
Match Detail: [Jaspar]
|
| ||
|---|---|---|
| Sites: 45/100 | e-val: 2.8e-19 | ||
| Factor | e-val(match) | DB |
| IRF1 | 0.00123 | JASPAR |
| NFATC2 | 0.0016881 | JASPAR |
| Lhx3 | 0.0032544 | JASPAR |
| ARID3A | 0.0064272 | JASPAR |
| Foxd3 | 0.0082016 | JASPAR |
BED file downloads
Top 10 Example Regions
| Location | Gene Link | Dist. |
|---|---|---|
| chr1: 150781300-150781450 | CTSK | 13.13 |
| chr19: 33787680-33787830 | LRP3 | 47.66 |
| chr11: 35156285-35156435 | CD44 | 56.34 |
| chr11: 35156285-35156435 | RP1-68D18.2 | 56.34 |
| chr2: 127934460-127934610 | ERCC3 | 57.71 |
| chr2: 127934460-127934610 | CYP27C1 | 57.71 |
| chr19: 18918900-18919050 | COPE | 60.04 |
| chr19: 18918900-18919050 | COMP | 60.04 |
| chr8: 102331040-102331190 | KB-1410C5.2 | 60.96 |
| chr2: 230209300-230209450 | PID1 | 62.04 |