SOM cluster: 1501
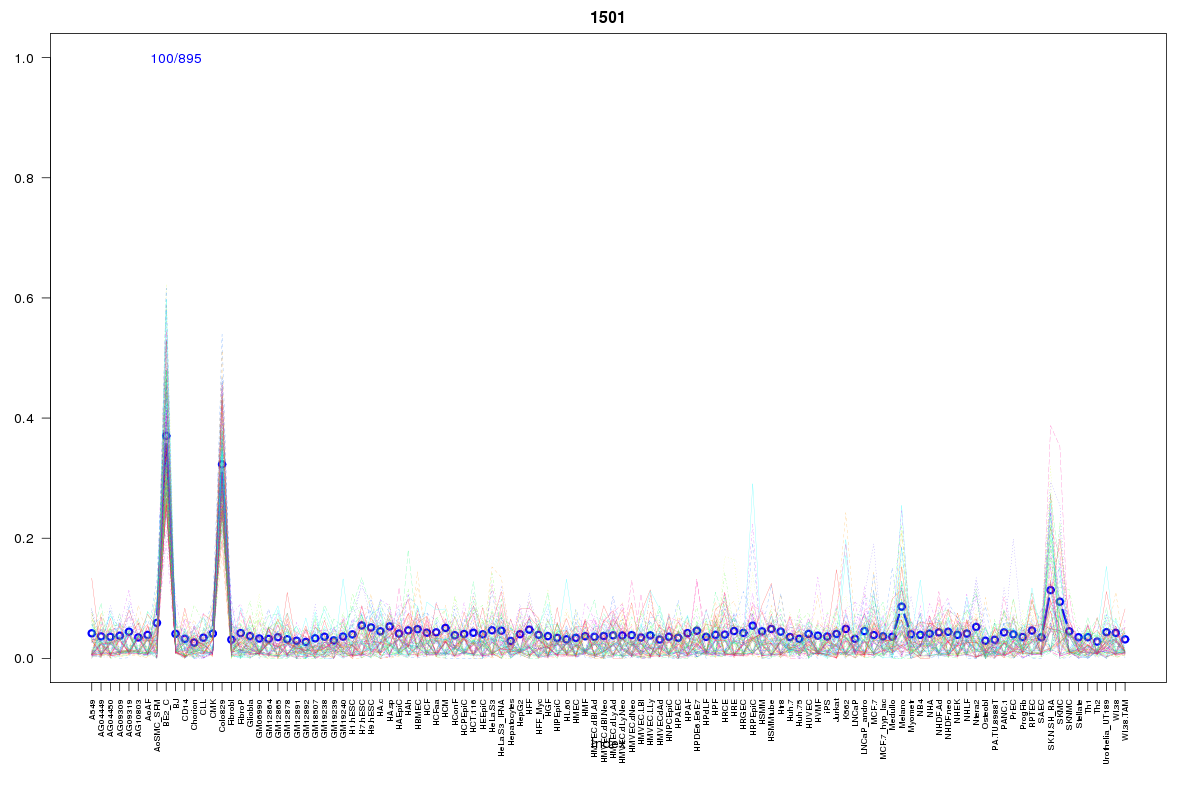
Cluster Hypersensitivity Profile

Genomic Location Trend
These plots show the distribution of the DHS sites surrounding the Transcript Start Site of the nearest gene.
Stats
Number of sites: 895Promoter: 1%
CpG-Island: 0%
Conserved: 38%
Enriched Motifs & Matches
No motifs found.BED file downloads
Top 10 Example Regions
| Location | Gene Link | Dist. |
|---|---|---|
| chr3: 156189180-156189330 | KCNAB1 | 43.77 |
| chr8: 10276020-10276170 | RP11-981G7.3 | 44.03 |
| chr20: 10303240-10303390 | SNAP25 | 45.07 |
| chr20: 8002425-8002575 | TMX4 | 45.35 |
| chr20: 8002425-8002575 | RP5-971N18.3 | 45.35 |
| chr1: 202631380-202631530 | PPP1R12B | 49.41 |
| chr1: 224731660-224731810 | AKR1B1P1 | 54.82 |
| chr4: 95848900-95849050 | BMPR1B | 55.14 |
| chr13: 44059140-44059290 | RPL36P19 | 57.9 |
| chr1: 210097860-210098010 | SYT14 | 59.73 |