SOM cluster: 1505
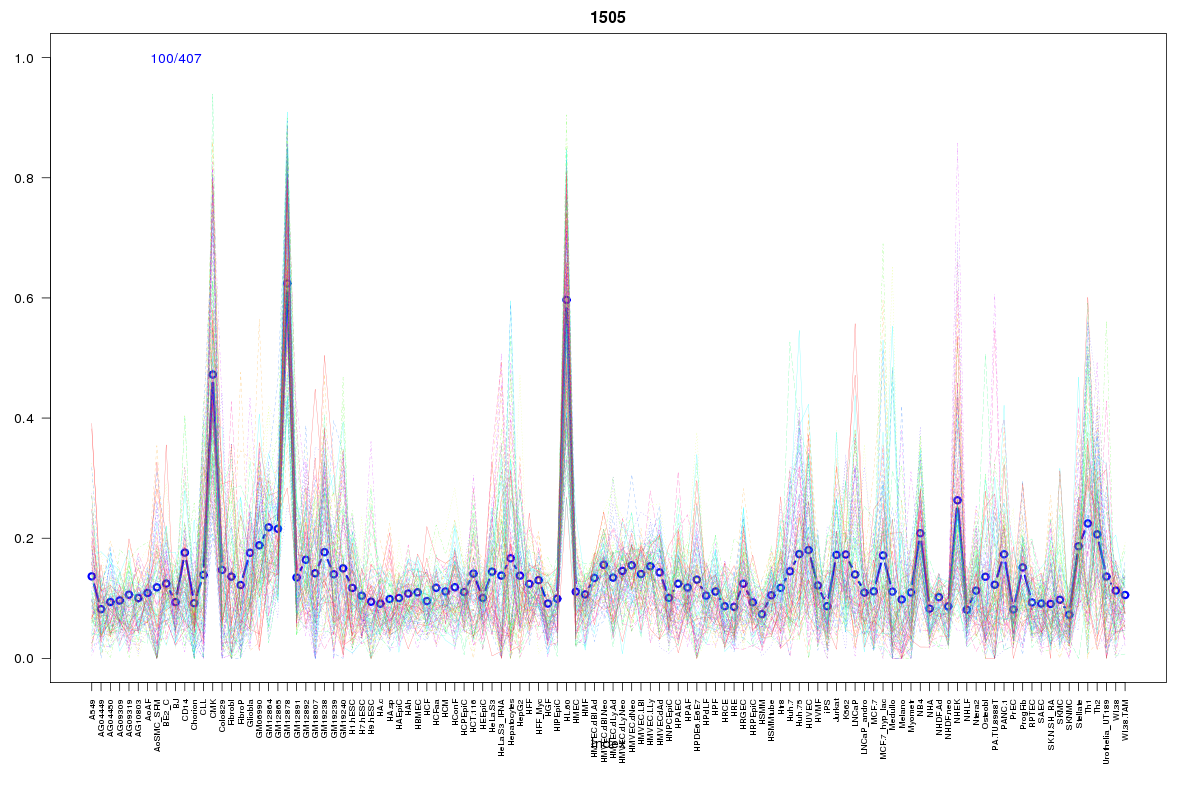
Cluster Hypersensitivity Profile

Genomic Location Trend
These plots show the distribution of the DHS sites surrounding the Transcript Start Site of the nearest gene.
Stats
Number of sites: 407Promoter: 31%
CpG-Island: 24%
Conserved: 42%
Enriched Motifs & Matches
Match Detail: [Jaspar]
|
| ||
|---|---|---|
| Sites: 41/100 | e-val: 0.000000023 | ||
| Factor | e-val(match) | DB |
| SP1 | 0.00000031816 | JASPAR |
| EWSR1-FLI1 | 0.000002613 | JASPAR |
| Pax4 | 0.000046247 | JASPAR |
| RREB1 | 0.00058544 | JASPAR |
| Klf4 | 0.00069065 | JASPAR |
BED file downloads
Top 10 Example Regions
| Location | Gene Link | Dist. |
|---|---|---|
| chr1: 145438945-145439095 | RBM8A | 19.51 |
| chr1: 145438945-145439095 | RP11-315I20.1 | 19.51 |
| chr3: 38204720-38204870 | ACAA1 | 39.09 |
| chr3: 50648100-50648250 | CISH | 44.28 |
| chr3: 50648100-50648250 | MAPKAPK3 | 44.28 |
| chr6: 31549360-31549510 | AIF1 | 47.51 |
| chr2: 38977780-38977930 | ASS1P2 | 50.6 |
| chr2: 101923000-101923150 | RFX8 | 51.53 |
| chr11: 65661760-65661910 | DRAP1 | 52.73 |
| chr11: 65661760-65661910 | MUS81 | 52.73 |