SOM cluster: 1513
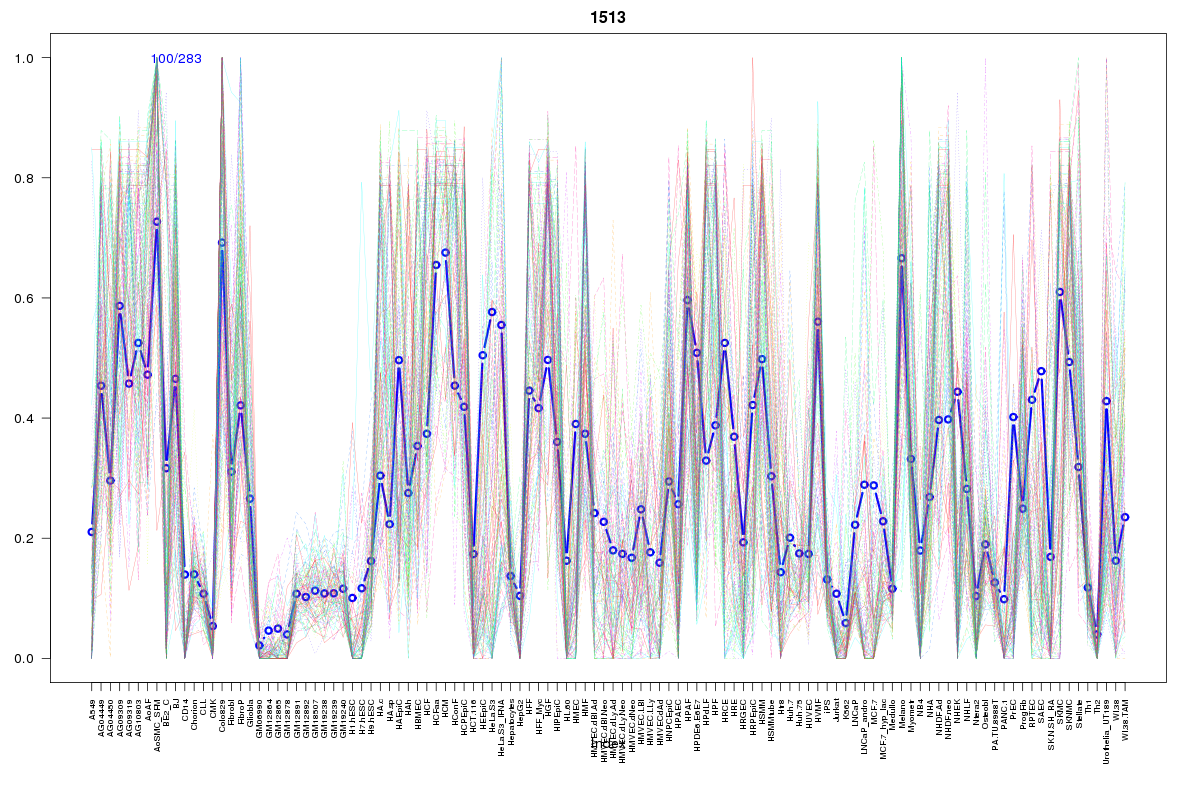
Cluster Hypersensitivity Profile

Genomic Location Trend
These plots show the distribution of the DHS sites surrounding the Transcript Start Site of the nearest gene.
Stats
Number of sites: 283Promoter: 0%
CpG-Island: 0%
Conserved: 66%
Enriched Motifs & Matches
Match Detail: [Jaspar]
|
| ||
|---|---|---|
| Sites: 32/100 | e-val: 0.000000000012 | ||
| Factor | e-val(match) | DB |
| TLX1::NFIC | 0.000000013999 | JASPAR |
| NFIC | 0.0013426 | JASPAR |
| E2F1 | 0.02869 | JASPAR |
| NFATC2 | 0.035052 | JASPAR |
| SOX10 | 0.047627 | JASPAR |
|
| ||
| Sites: 19/100 | e-val: 0.011 | ||
| Factor | e-val(match) | DB |
| Pou5f1 | 0.0000097219 | JASPAR |
| NFATC2 | 0.00002094 | JASPAR |
| Sox2 | 0.000027699 | JASPAR |
| IRF1 | 0.00017252 | JASPAR |
| IRF2 | 0.0017581 | JASPAR |
|
| ||
| Sites: 20/100 | e-val: 0.51 | ||
| Factor | e-val(match) | DB |
| Foxd3 | 0.00040583 | JASPAR |
| HNF1B | 0.00083481 | JASPAR |
| Foxq1 | 0.0010706 | JASPAR |
| Pax4 | 0.0038738 | JASPAR |
| Lhx3 | 0.0051095 | JASPAR |
BED file downloads
Top 10 Example Regions
| Location | Gene Link | Dist. |
|---|---|---|
| chr9: 109683780-109683930 | RP11-508N12.2 | 27.14 |
| chr7: 42036420-42036570 | GLI3 | 40.62 |
| chr17: 56864420-56864570 | TEX14 | 42.19 |
| chr8: 121873660-121873810 | SNTB1 | 43.14 |
| chr7: 127906940-127907090 | LEP | 49.87 |
| chr10: 17390720-17390870 | ST8SIA6-AS1 | 54.17 |
| chr7: 73892160-73892310 | GTF2IRD1 | 56.35 |
| chr4: 187590700-187590850 | FAT1 | 58.19 |
| chr10: 114818540-114818690 | TCF7L2 | 60.84 |
| chr1: 179138900-179139050 | SETP10 | 62.37 |