SOM cluster: 1515
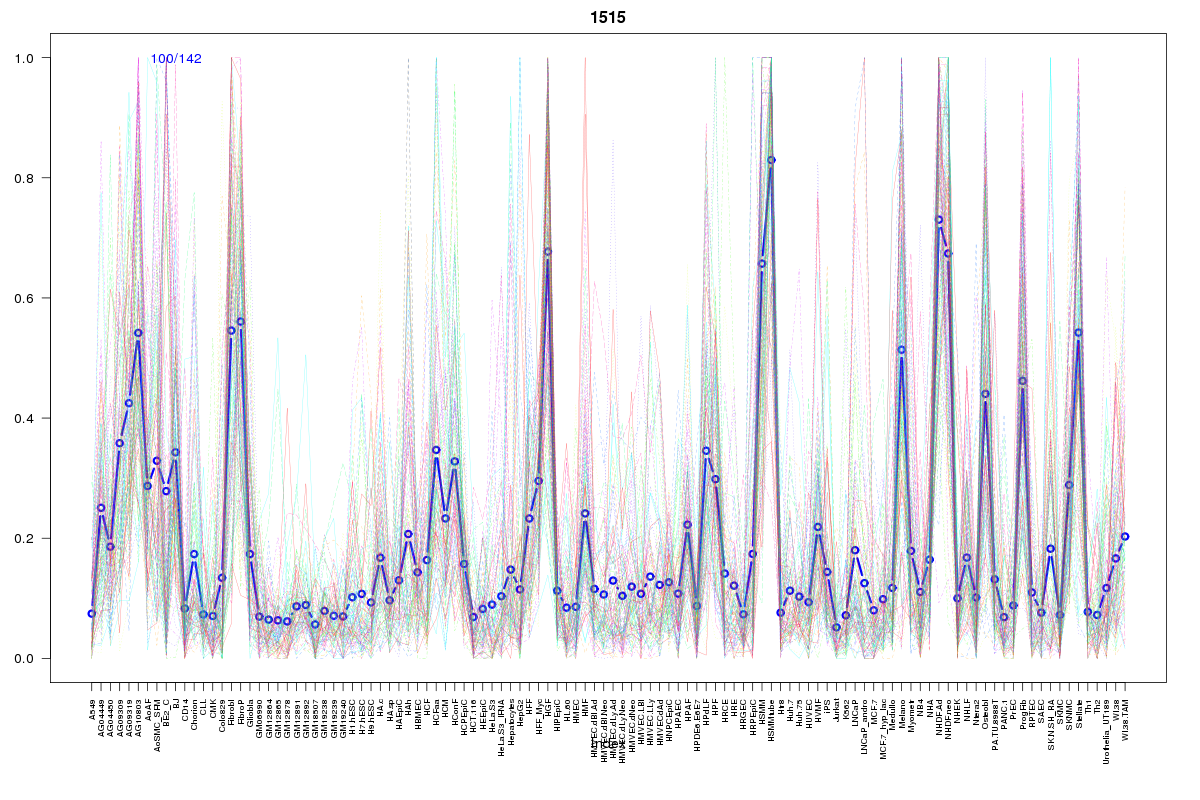
Cluster Hypersensitivity Profile

Genomic Location Trend
These plots show the distribution of the DHS sites surrounding the Transcript Start Site of the nearest gene.
Stats
Number of sites: 142Promoter: 5%
CpG-Island: 1%
Conserved: 60%
Enriched Motifs & Matches
Match Detail: [Jaspar]
|
| ||
|---|---|---|
| Sites: 57/100 | e-val: 0.0000000000022 | ||
| Factor | e-val(match) | DB |
| REST | 0.00055779 | JASPAR |
| ESR1 | 0.00145 | JASPAR |
| NFE2L2 | 0.012538 | JASPAR |
| RORA_1 | 0.015843 | JASPAR |
| Zfx | 0.020944 | JASPAR |
|
| ||
| Sites: 49/100 | e-val: 0.0000000029 | ||
| Factor | e-val(match) | DB |
| TEAD1 | 0.0022576 | JASPAR |
| EWSR1-FLI1 | 0.0038639 | JASPAR |
| SP1 | 0.010041 | JASPAR |
| HNF4A | 0.036446 | JASPAR |
| Pax4 | 0.046211 | JASPAR |
|
| ||
| Sites: 47/100 | e-val: 0.00000049 | ||
| Factor | e-val(match) | DB |
| Myf | 0.00000014804 | JASPAR |
| NHLH1 | 0.0000011738 | JASPAR |
| TAL1::TCF3 | 0.000032094 | JASPAR |
| CTCF | 0.0071956 | JASPAR |
| Nr2e3 | 0.040375 | JASPAR |
BED file downloads
Top 10 Example Regions
| Location | Gene Link | Dist. |
|---|---|---|
| chr6: 16544380-16544530 | ATXN1 | 46.24 |
| chr1: 22254140-22254290 | RP1-224A6.3 | 47.89 |
| chr1: 54715880-54716030 | RP5-997D24.3 | 56.65 |
| chr8: 99350540-99350690 | KCNS2 | 57.17 |
| chr11: 19618180-19618330 | SNORA1 | 59.58 |
| chr11: 19618180-19618330 | NAV2-AS5 | 59.58 |
| chr10: 50317945-50318095 | VSTM4 | 63.13 |
| chr10: 50317945-50318095 | C10orf128 | 63.13 |
| chr10: 50317945-50318095 | RP11-523O18.1 | 63.13 |
| chr1: 22223320-22223470 | HSPG2 | 66.89 |