SOM cluster: 1525
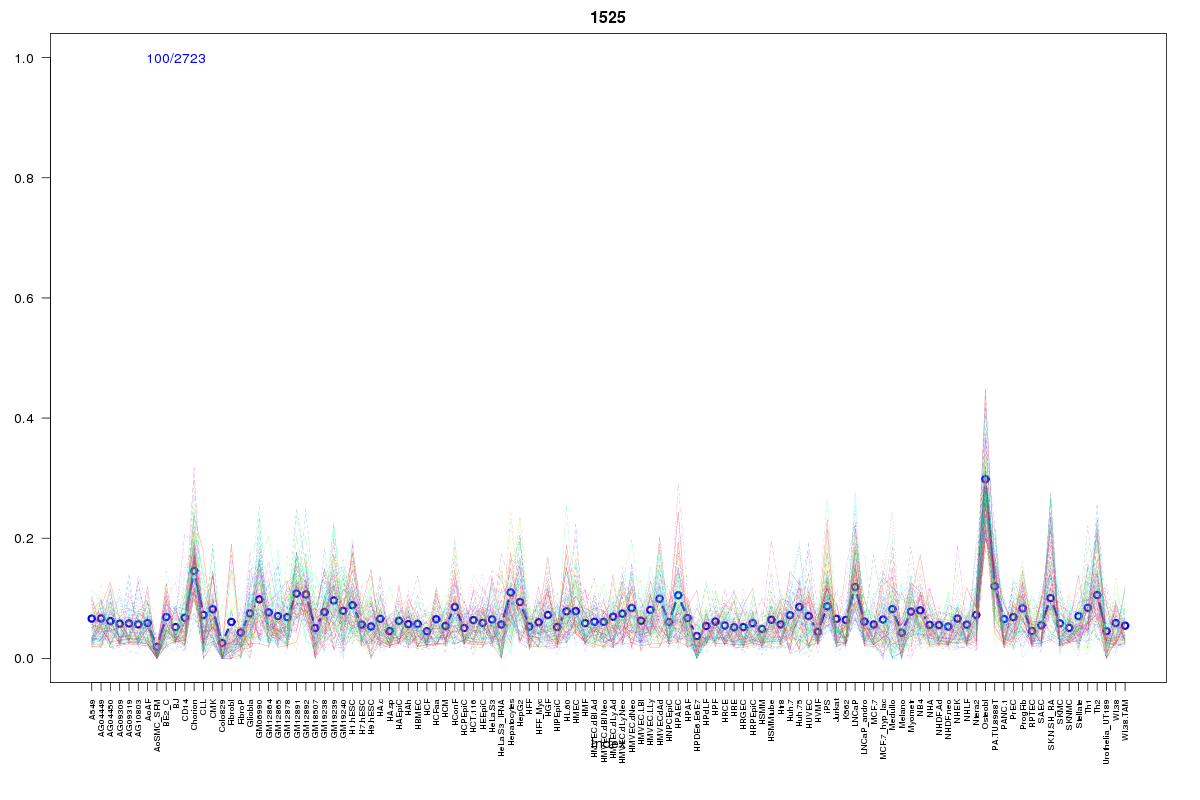
Cluster Hypersensitivity Profile

Genomic Location Trend
These plots show the distribution of the DHS sites surrounding the Transcript Start Site of the nearest gene.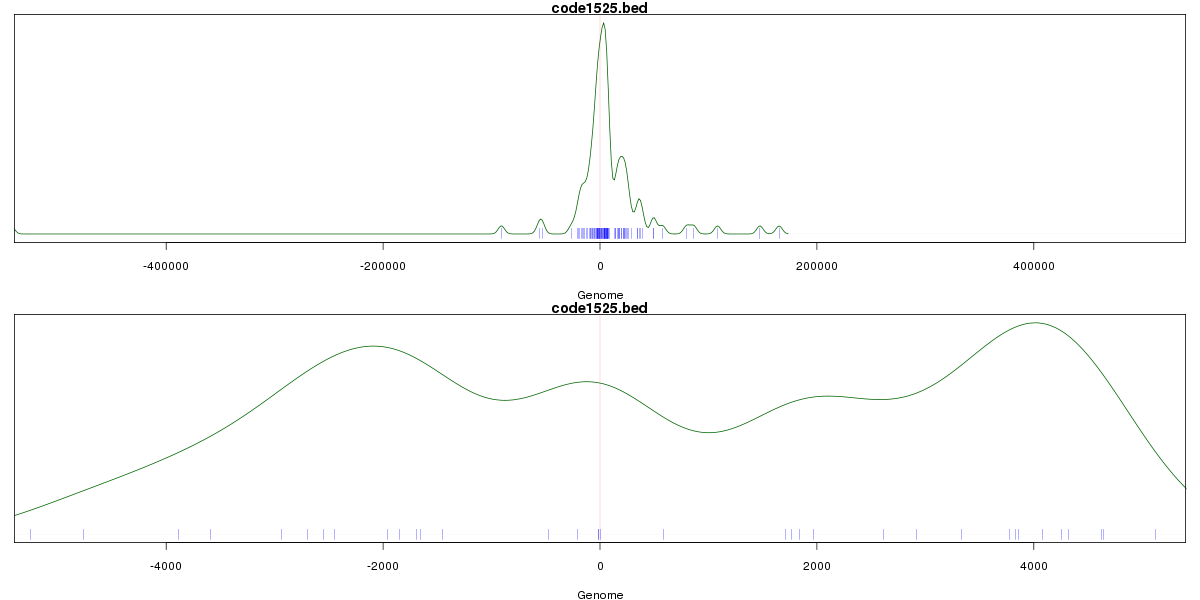
Stats
Number of sites: 2723Promoter: 10%
CpG-Island: 10%
Conserved: 44%
Enriched Motifs & Matches
Match Detail: [Jaspar]
|
| ||
|---|---|---|
| Sites: 95/100 | e-val: 0 | ||
| Factor | e-val(match) | DB |
| SP1 | 0.0000082852 | JASPAR |
| PLAG1 | 0.000093363 | JASPAR |
| TFAP2A | 0.00011766 | JASPAR |
| RREB1 | 0.0013703 | JASPAR |
| CTCF | 0.0020303 | JASPAR |
|
| ||
| Sites: 69/100 | e-val: 5.1e-17 | ||
| Factor | e-val(match) | DB |
| INSM1 | 0.00000061111 | JASPAR |
| TLX1::NFIC | 0.000016199 | JASPAR |
| HNF4A | 0.000081124 | JASPAR |
| PPARG::RXRA | 0.000088527 | JASPAR |
| CTCF | 0.00069908 | JASPAR |
|
| ||
| Sites: 25/100 | e-val: 1.8 | ||
| Factor | e-val(match) | DB |
| REST | 0.00049803 | JASPAR |
| RXR::RAR_DR5 | 0.0069771 | JASPAR |
| REL | 0.0094087 | JASPAR |
| TP53 | 0.0097045 | JASPAR |
| Zfx | 0.017618 | JASPAR |
BED file downloads
Top 10 Example Regions
| Location | Gene Link | Dist. |
|---|---|---|
| chr10: 102881385-102881535 | TLX1NB | 29.78 |
| chr9: 139329205-139329355 | SEC16A | 33.81 |
| chr17: 79135365-79135515 | ENTHD2 | 37.98 |
| chr8: 21991505-21991655 | LGI3 | 54.03 |
| chr19: 35842105-35842255 | CD22 | 55.04 |
| chr19: 35842105-35842255 | FFAR1 | 55.04 |
| chr12: 49431885-49432035 | PRKAG1 | 55.25 |
| chr9: 139578620-139578770 | ATP6V1G1P3 | 56.33 |
| chr3: 129330285-129330435 | RHO | 56.93 |
| chr8: 143846465-143846615 | GML | 57.21 |