SOM cluster: 1528
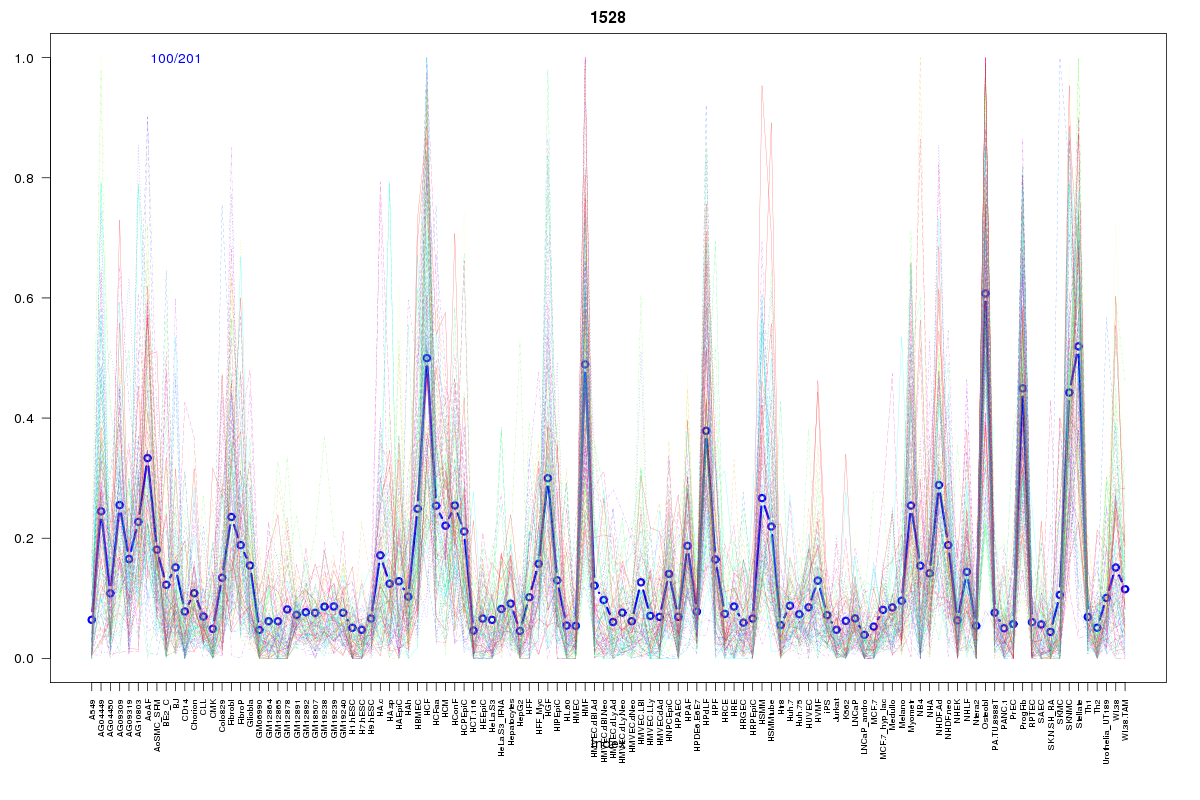
Cluster Hypersensitivity Profile

Genomic Location Trend
These plots show the distribution of the DHS sites surrounding the Transcript Start Site of the nearest gene.
Stats
Number of sites: 201Promoter: 3%
CpG-Island: 0%
Conserved: 34%
Enriched Motifs & Matches
Match Detail: [Jaspar]
|
| ||
|---|---|---|
| Sites: 37/100 | e-val: 0.000000000000029 | ||
| Factor | e-val(match) | DB |
| EBF1 | 0.000000000029888 | JASPAR |
| MZF1_1-4 | 0.00058972 | JASPAR |
| Zfp423 | 0.00089306 | JASPAR |
| PLAG1 | 0.0013959 | JASPAR |
| INSM1 | 0.0017503 | JASPAR |
BED file downloads
Top 10 Example Regions
| Location | Gene Link | Dist. |
|---|---|---|
| chr2: 28692380-28692530 | FOSL2 | 36.25 |
| chr16: 86668900-86669050 | FOXC2 | 48.1 |
| chr19: 33647340-33647490 | RHPN2 | 51.92 |
| chr19: 33647340-33647490 | WDR88 | 51.92 |
| chr16: 88471925-88472075 | ZNF469 | 60.59 |
| chr17: 55991060-55991210 | CUEDC1 | 62.9 |
| chr21: 38434400-38434550 | TTC3 | 64.89 |
| chr14: 52733600-52733750 | PTGDR | 65.89 |
| chr20: 32268620-32268770 | ZNF341 | 67.17 |
| chr20: 32268620-32268770 | E2F1 | 67.17 |