SOM cluster: 1529
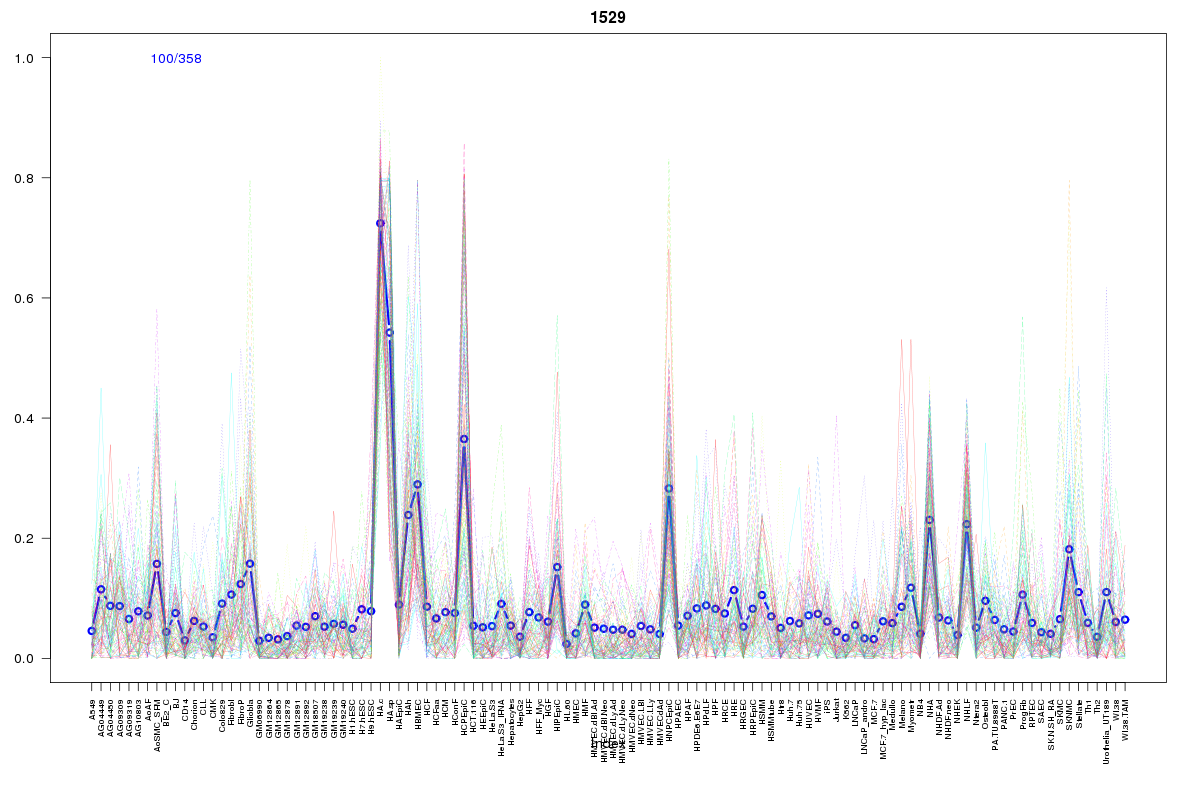
Cluster Hypersensitivity Profile

Genomic Location Trend
These plots show the distribution of the DHS sites surrounding the Transcript Start Site of the nearest gene.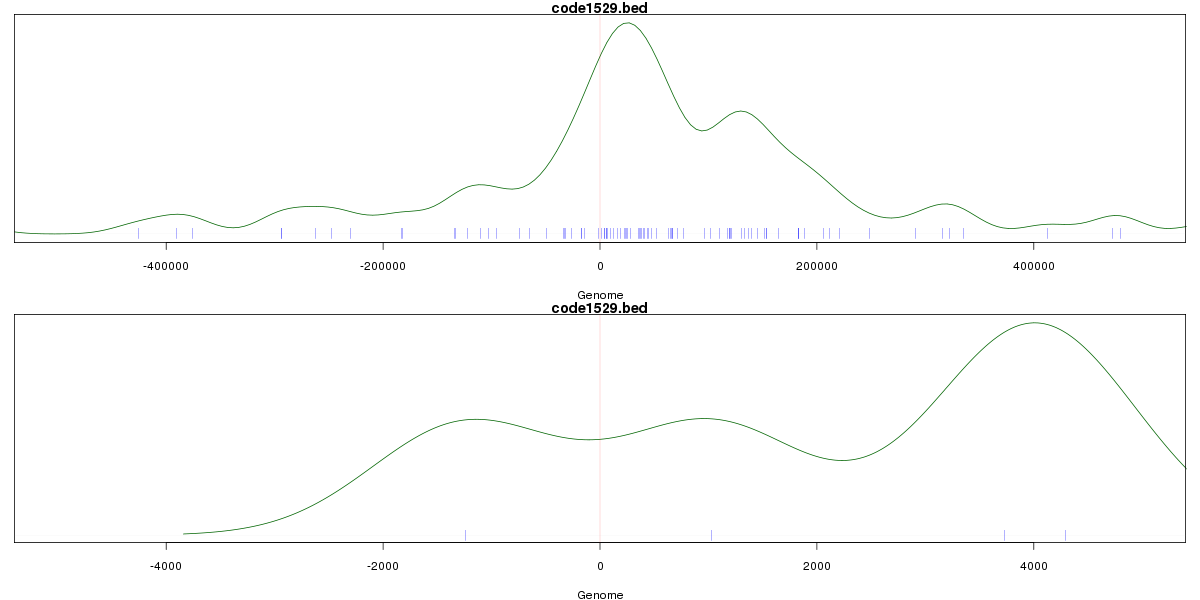
Stats
Number of sites: 358Promoter: 2%
CpG-Island: 0%
Conserved: 32%
Enriched Motifs & Matches
Match Detail: [Jaspar]
|
| ||
|---|---|---|
| Sites: 22/100 | e-val: 0.091 | ||
| Factor | e-val(match) | DB |
| Foxd3 | 0.000030719 | JASPAR |
| FOXI1 | 0.000073047 | JASPAR |
| Foxq1 | 0.000073591 | JASPAR |
| Lhx3 | 0.00057926 | JASPAR |
| MEF2A | 0.00071006 | JASPAR |
BED file downloads
Top 10 Example Regions
| Location | Gene Link | Dist. |
|---|---|---|
| chr5: 119852520-119852670 | PRR16 | 31.71 |
| chr13: 110979725-110979875 | COL4A1 | 49.72 |
| chr2: 47426720-47426870 | CALM2 | 52.49 |
| chr5: 72634700-72634850 | RP11-79P5.3 | 58.74 |
| chr10: 50577600-50577750 | RP11-123B3.2 | 66.87 |
| chr1: 171191140-171191290 | FMO1 | 71.18 |
| chr9: 132508740-132508890 | TOR1B | 71.76 |
| chr9: 132508740-132508890 | PTGES | 71.76 |
| chr3: 147109620-147109770 | ZIC1 | 75.72 |
| chr3: 147109620-147109770 | ZIC4 | 75.72 |