SOM cluster: 1538
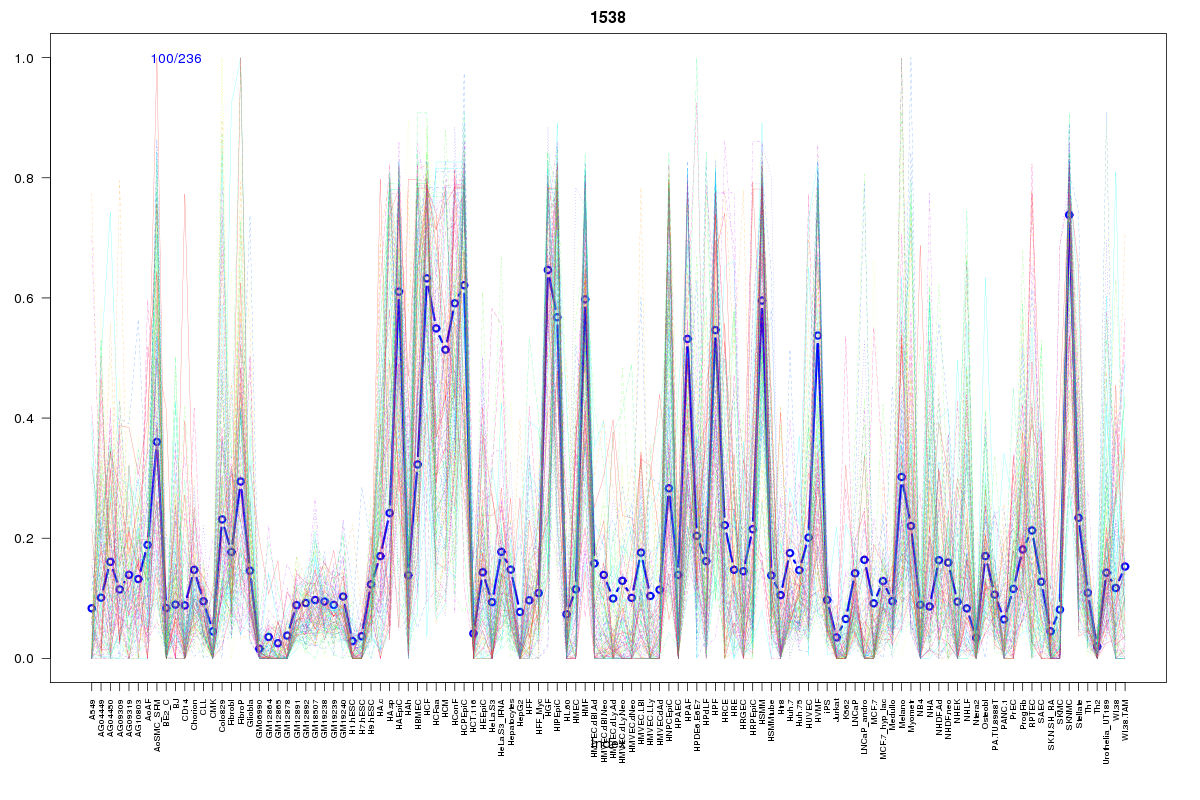
Cluster Hypersensitivity Profile

Genomic Location Trend
These plots show the distribution of the DHS sites surrounding the Transcript Start Site of the nearest gene.
Stats
Number of sites: 236Promoter: 1%
CpG-Island: 0%
Conserved: 41%
Enriched Motifs & Matches
Match Detail: [Jaspar]
|
| ||
|---|---|---|
| Sites: 40/100 | e-val: 1.8e-33 | ||
| Factor | e-val(match) | DB |
| NR3C1 | 0.0000000000000096589 | JASPAR |
| Ar | 0.0000000198 | JASPAR |
| Sox5 | 0.0043342 | JASPAR |
| SOX10 | 0.0045931 | JASPAR |
| RXRA::VDR | 0.014679 | JASPAR |
BED file downloads
Top 10 Example Regions
| Location | Gene Link | Dist. |
|---|---|---|
| chr1: 86000380-86000530 | RP11-131L23.1 | 43.18 |
| chr10: 91262420-91262570 | LIPA | 52.68 |
| chr10: 91262420-91262570 | IFIT5 | 52.68 |
| chr10: 91262420-91262570 | SLC16A12 | 52.68 |
| chr17: 61112760-61112910 | TANC2 | 54.05 |
| chr3: 12185580-12185730 | TIMP4 | 60.42 |
| chr4: 74872060-74872210 | CXCL5 | 60.97 |
| chr4: 74872060-74872210 | PF4 | 60.97 |
| chr4: 74872060-74872210 | CXCL3 | 60.97 |
| chr11: 26621100-26621250 | SLC5A12 | 63.31 |