SOM cluster: 1542
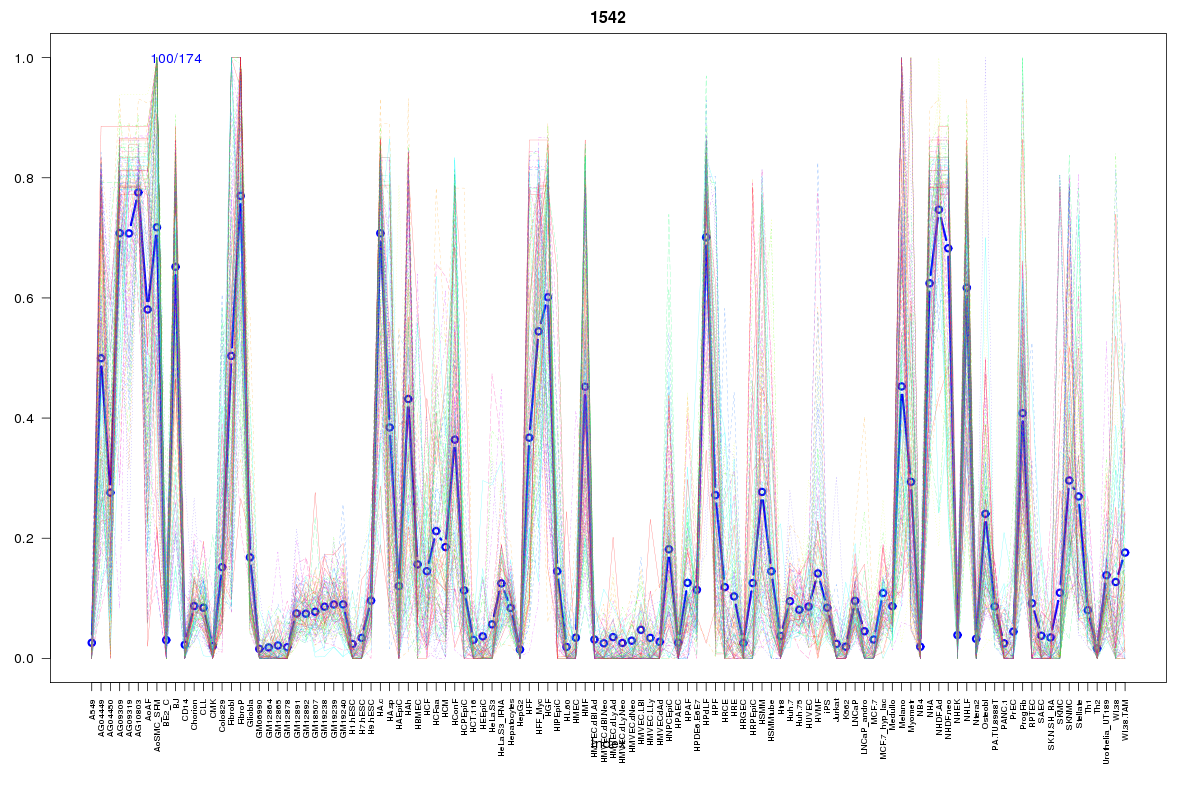
Cluster Hypersensitivity Profile

Genomic Location Trend
These plots show the distribution of the DHS sites surrounding the Transcript Start Site of the nearest gene.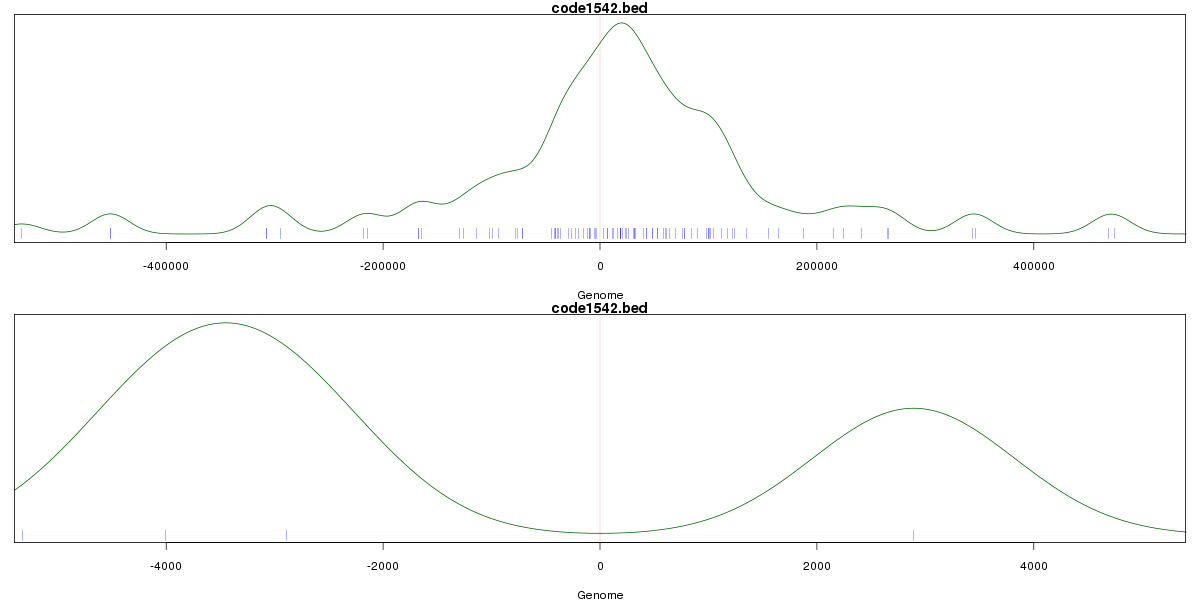
Stats
Number of sites: 174Promoter: 0%
CpG-Island: 0%
Conserved: 61%
Enriched Motifs & Matches
Match Detail: [Jaspar]
|
| ||
|---|---|---|
| Sites: 23/100 | e-val: 0.12 | ||
| Factor | e-val(match) | DB |
| Foxd3 | 0.0000046953 | JASPAR |
| MEF2A | 0.000013837 | JASPAR |
| Foxq1 | 0.000040492 | JASPAR |
| FOXI1 | 0.0013053 | JASPAR |
| Pax4 | 0.0050124 | JASPAR |
BED file downloads
Top 10 Example Regions
| Location | Gene Link | Dist. |
|---|---|---|
| chr8: 12966420-12966570 | Y_RNA | 33.04 |
| chr8: 12966420-12966570 | DLC1 | 33.04 |
| chr8: 43026940-43027090 | RP11-598P20.5 | 41.64 |
| chr1: 212487080-212487230 | TMEM206 | 51.05 |
| chr1: 212487080-212487230 | SNORA16B | 51.05 |
| chr13: 99401900-99402050 | SLC15A1 | 51.68 |
| chr13: 99401900-99402050 | DOCK9-AS1 | 51.68 |
| chr9: 16715580-16715730 | RP11-62F24.2 | 52.62 |
| chr9: 16715580-16715730 | BNC2 | 52.62 |
| chr6: 16136900-16137050 | RP1-13D10.2 | 52.68 |