SOM cluster: 1545
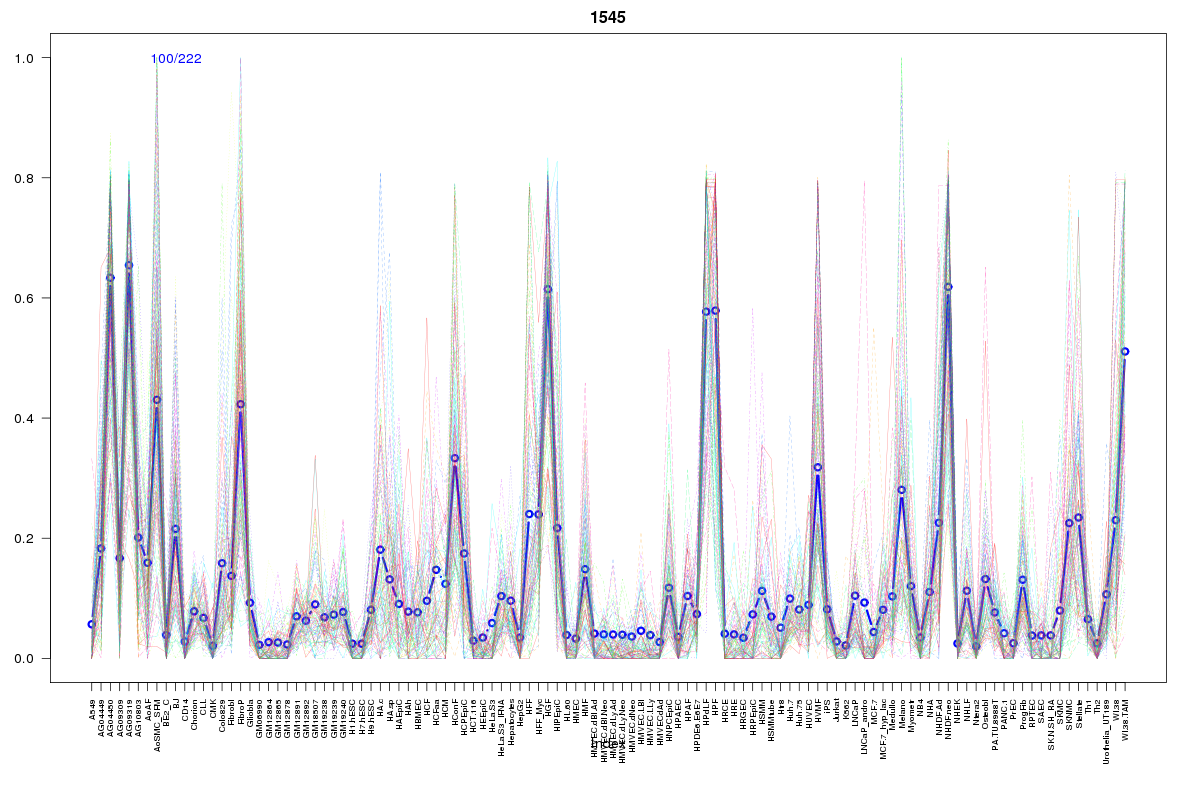
Cluster Hypersensitivity Profile

Genomic Location Trend
These plots show the distribution of the DHS sites surrounding the Transcript Start Site of the nearest gene.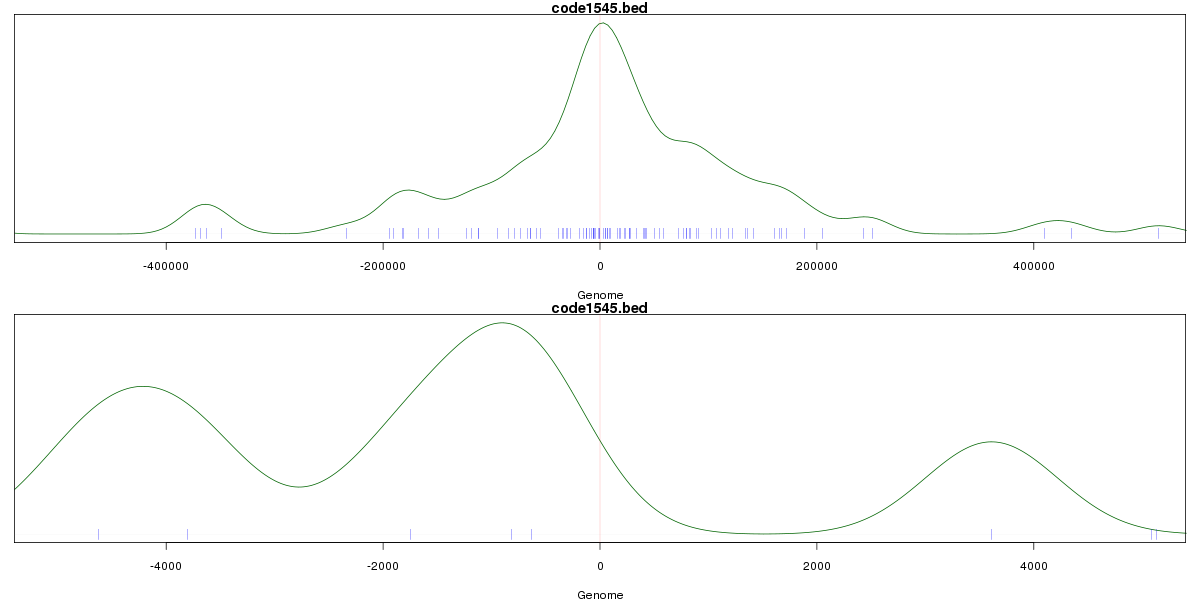
Stats
Number of sites: 222Promoter: 3%
CpG-Island: 0%
Conserved: 56%
Enriched Motifs & Matches
Match Detail: [Jaspar]
|
| ||
|---|---|---|
| Sites: 55/100 | e-val: 0.000000000000097 | ||
| Factor | e-val(match) | DB |
| FOXI1 | 0.000000091282 | JASPAR |
| Foxq1 | 0.00000036375 | JASPAR |
| Foxa2 | 0.00000053487 | JASPAR |
| FOXA1 | 0.000003135 | JASPAR |
| Foxd3 | 0.000003643 | JASPAR |
BED file downloads
Top 10 Example Regions
| Location | Gene Link | Dist. |
|---|---|---|
| chr6: 119065040-119065190 | MCM9 | 40.86 |
| chr1: 171085940-171086090 | FMO3 | 49.44 |
| chr1: 33858380-33858530 | ZNF362 | 52.91 |
| chr1: 33858380-33858530 | AL513327.1 | 52.91 |
| chr10: 14821520-14821670 | CDNF | 57.18 |
| chr10: 14821520-14821670 | HSPA14 | 57.18 |
| chr10: 14821520-14821670 | SUV39H2 | 57.18 |
| chr8: 95347660-95347810 | GEM | 58.81 |
| chr8: 95347660-95347810 | RAD54B | 58.81 |
| chr16: 15592760-15592910 | C16orf45 | 60.45 |