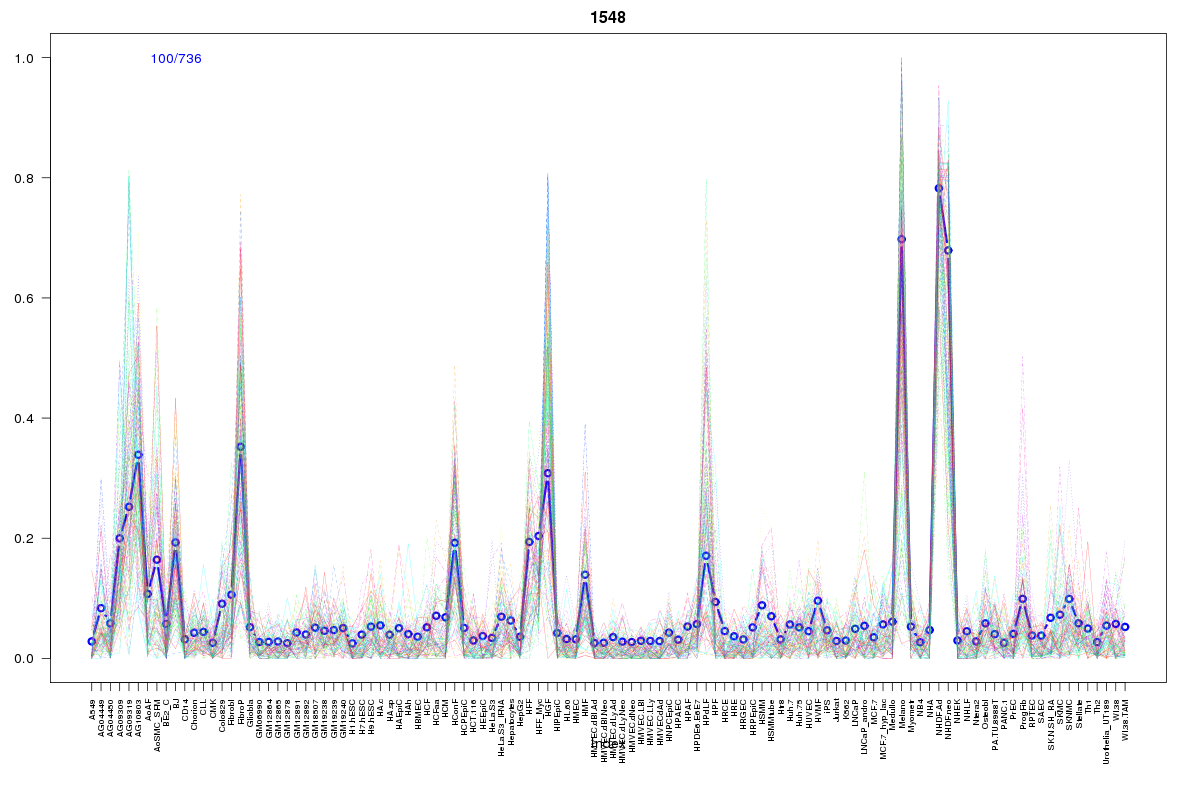
SOM cluster: 1548
Cluster Hypersensitivity Profile

Genomic Location Trend
These plots show the distribution of the DHS sites surrounding the Transcript Start Site of the nearest gene.
Stats
Number of sites: 736Promoter: 0%
CpG-Island: 0%
Conserved: 50%
Enriched Motifs & Matches
Match Detail: [Jaspar]
|
| ||
|---|---|---|
| Sites: 47/100 | e-val: 4.6e-17 | ||
| Factor | e-val(match) | DB |
| TAL1::TCF3 | 0.000040237 | JASPAR |
| HNF1A | 0.000063116 | JASPAR |
| HNF1B | 0.003125 | JASPAR |
| MEF2A | 0.0036177 | JASPAR |
| Foxq1 | 0.0041806 | JASPAR |
BED file downloads
Top 10 Example Regions
| Location | Gene Link | Dist. |
|---|---|---|
| chr1: 91993460-91993610 | RP11-47K11.2 | 25.8 |
| chr1: 145491940-145492090 | HFE2 | 43.12 |
| chr11: 35180065-35180215 | RP1-68D18.2 | 53.81 |
| chr17: 19367400-19367550 | AC004448.5 | 54.86 |
| chr17: 19367400-19367550 | MAPK7 | 54.86 |
| chr12: 54619580-54619730 | RP11-834C11.8 | 56.62 |
| chr12: 54619580-54619730 | RP11-834C11.4 | 56.62 |
| chrX: 3217820-3217970 | MXRA5 | 58.44 |
| chr17: 15124280-15124430 | PMP22 | 60.49 |
| chr8: 38186560-38186710 | FGFR1 | 61.14 |