SOM cluster: 1553
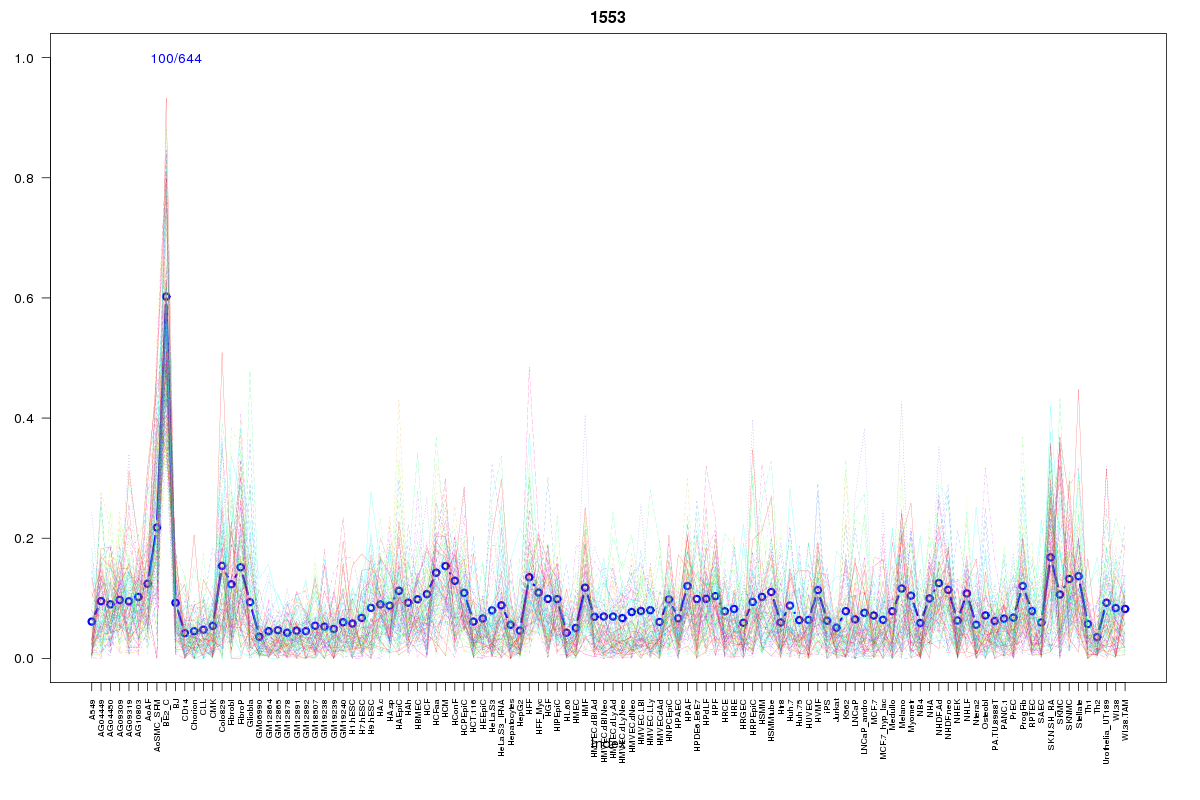
Cluster Hypersensitivity Profile

Genomic Location Trend
These plots show the distribution of the DHS sites surrounding the Transcript Start Site of the nearest gene.
Stats
Number of sites: 644Promoter: 0%
CpG-Island: 0%
Conserved: 38%
Enriched Motifs & Matches
Match Detail: [Jaspar]
|
| ||
|---|---|---|
| Sites: 14/100 | e-val: 1.8 | ||
| Factor | e-val(match) | DB |
| ESR1 | 0.0015229 | JASPAR |
| EWSR1-FLI1 | 0.0022798 | JASPAR |
| FEV | 0.0048634 | JASPAR |
| SP1 | 0.0079909 | JASPAR |
| ELK4 | 0.0080812 | JASPAR |
BED file downloads
Top 10 Example Regions
| Location | Gene Link | Dist. |
|---|---|---|
| chr17: 48708980-48709130 | ANKRD40 | 45.51 |
| chr5: 71406300-71406450 | MAP1B | 49.19 |
| chr5: 141549360-141549510 | NDFIP1 | 49.42 |
| chr17: 13416380-13416530 | HS3ST3A1 | 51.07 |
| chr12: 110140380-110140530 | FAM222A | 52.79 |
| chr3: 157883680-157883830 | SHOX2 | 56.76 |
| chr3: 157883680-157883830 | RSRC1 | 56.76 |
| chr13: 44812060-44812210 | SMIM2-AS1 | 57.83 |
| chr1: 202281040-202281190 | PPP1R12B | 58.75 |
| chr5: 168249840-168249990 | MIR218-2 | 60.73 |