SOM cluster: 1558
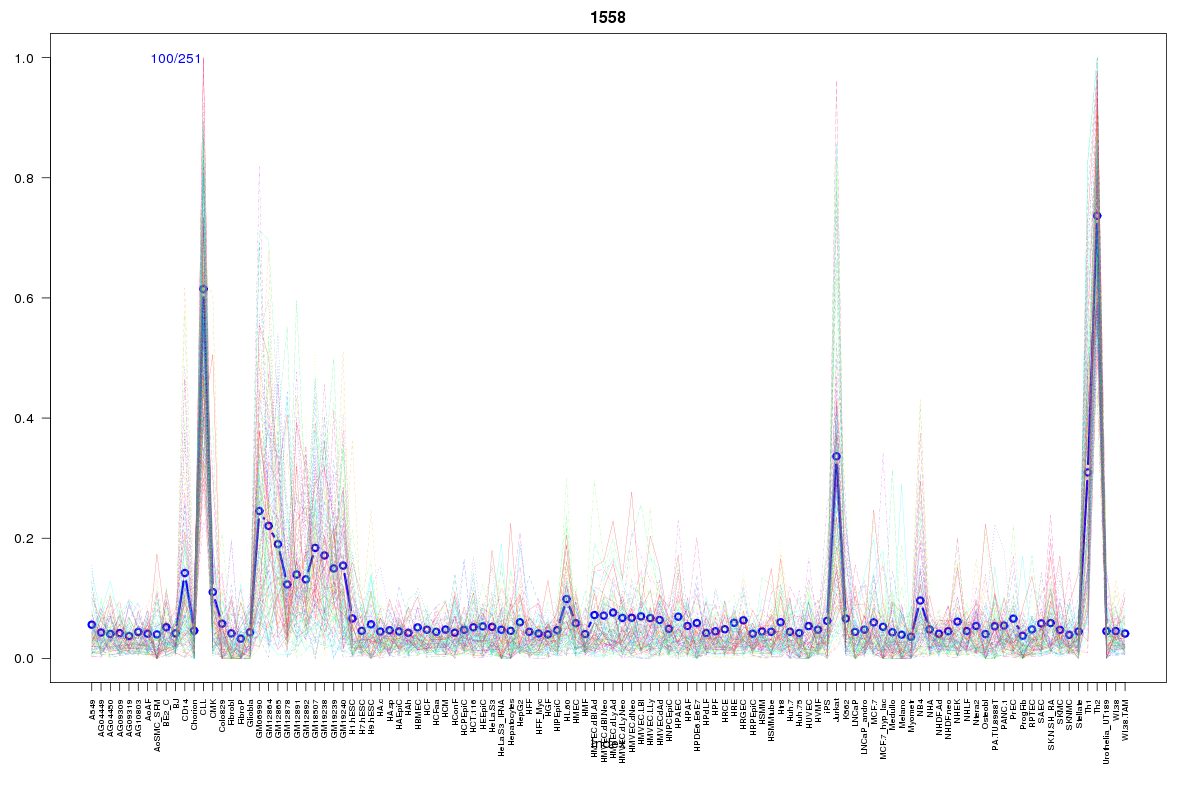
Cluster Hypersensitivity Profile

Genomic Location Trend
These plots show the distribution of the DHS sites surrounding the Transcript Start Site of the nearest gene.
Stats
Number of sites: 251Promoter: 10%
CpG-Island: 1%
Conserved: 40%
Enriched Motifs & Matches
Match Detail: [Jaspar]
|
| ||
|---|---|---|
| Sites: 34/100 | e-val: 0.000000028 | ||
| Factor | e-val(match) | DB |
| IRF1 | 0.000089801 | JASPAR |
| Foxd3 | 0.00011182 | JASPAR |
| FOXI1 | 0.0043586 | JASPAR |
| IRF2 | 0.0045539 | JASPAR |
| SRY | 0.014573 | JASPAR |
BED file downloads
Top 10 Example Regions
| Location | Gene Link | Dist. |
|---|---|---|
| chr8: 8727160-8727310 | MFHAS1 | 31.62 |
| chr19: 50056200-50056350 | NOSIP | 34.4 |
| chr19: 50056200-50056350 | SNORD33 | 34.4 |
| chr19: 50056200-50056350 | FLT3LG | 34.4 |
| chr1: 169662380-169662530 | METTL18 | 50.47 |
| chr1: 169662380-169662530 | SELL | 50.47 |
| chr19: 10519380-10519530 | TYK2 | 55.72 |
| chr19: 10519380-10519530 | ICAM3 | 55.72 |
| chr17: 27220460-27220610 | FLOT2 | 58.11 |
| chr3: 45911700-45911850 | Y_RNA | 61.79 |