SOM cluster: 156
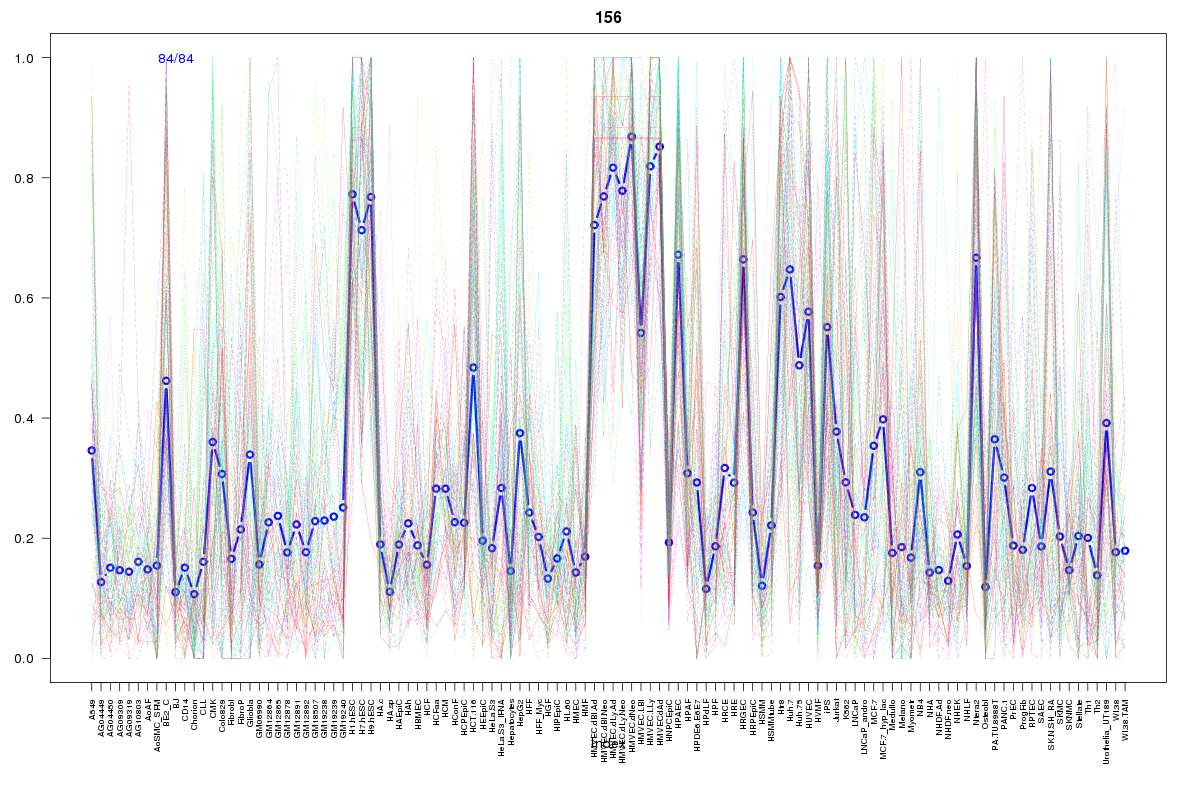
Cluster Hypersensitivity Profile

Genomic Location Trend
These plots show the distribution of the DHS sites surrounding the Transcript Start Site of the nearest gene.
Stats
Number of sites: 84Promoter: 11%
CpG-Island: 10%
Conserved: 51%
Enriched Motifs & Matches
Match Detail: [Jaspar]
|
| ||
|---|---|---|
| Sites: 37/84 | e-val: 0.00000000000055 | ||
| Factor | e-val(match) | DB |
| SP1 | 0.0000036505 | JASPAR |
| EWSR1-FLI1 | 0.000083106 | JASPAR |
| Pax4 | 0.00084476 | JASPAR |
| PPARG::RXRA | 0.0012938 | JASPAR |
| Tal1::Gata1 | 0.0062502 | JASPAR |
|
| ||
| Sites: 29/84 | e-val: 0.0000000045 | ||
| Factor | e-val(match) | DB |
| CTCF | 0.0000004705 | JASPAR |
| Myf | 0.00021037 | JASPAR |
| INSM1 | 0.00024579 | JASPAR |
| PLAG1 | 0.0043295 | JASPAR |
| SP1 | 0.013632 | JASPAR |
|
| ||
| Sites: 11/84 | e-val: 0.042 | ||
| Factor | e-val(match) | DB |
| TLX1::NFIC | 0.00000085638 | JASPAR |
| RORA_2 | 0.017526 | JASPAR |
| NR4A2 | 0.017557 | JASPAR |
| REST | 0.021924 | JASPAR |
| PPARG | 0.045606 | JASPAR |
BED file downloads
Top 10 Example Regions
| Location | Gene Link | Dist. |
|---|---|---|
| chr8: 81806080-81806230 | ZNF704 | 37.87 |
| chr8: 81806080-81806230 | PAG1 | 37.87 |
| chr2: 54730400-54730550 | SPTBN1 | 43.49 |
| chr20: 50677700-50677850 | ZFP64 | 52.4 |
| chr8: 38299920-38300070 | RP11-350N15.3 | 55.31 |
| chr17: 74025640-74025790 | GALR2 | 57.75 |
| chr5: 132583680-132583830 | FSTL4 | 60.35 |
| chr8: 80696120-80696270 | HEY1 | 64.75 |
| chr16: 58498865-58499015 | RNU6-103P | 65.54 |
| chr16: 58498865-58499015 | NDRG4 | 65.54 |