SOM cluster: 1566
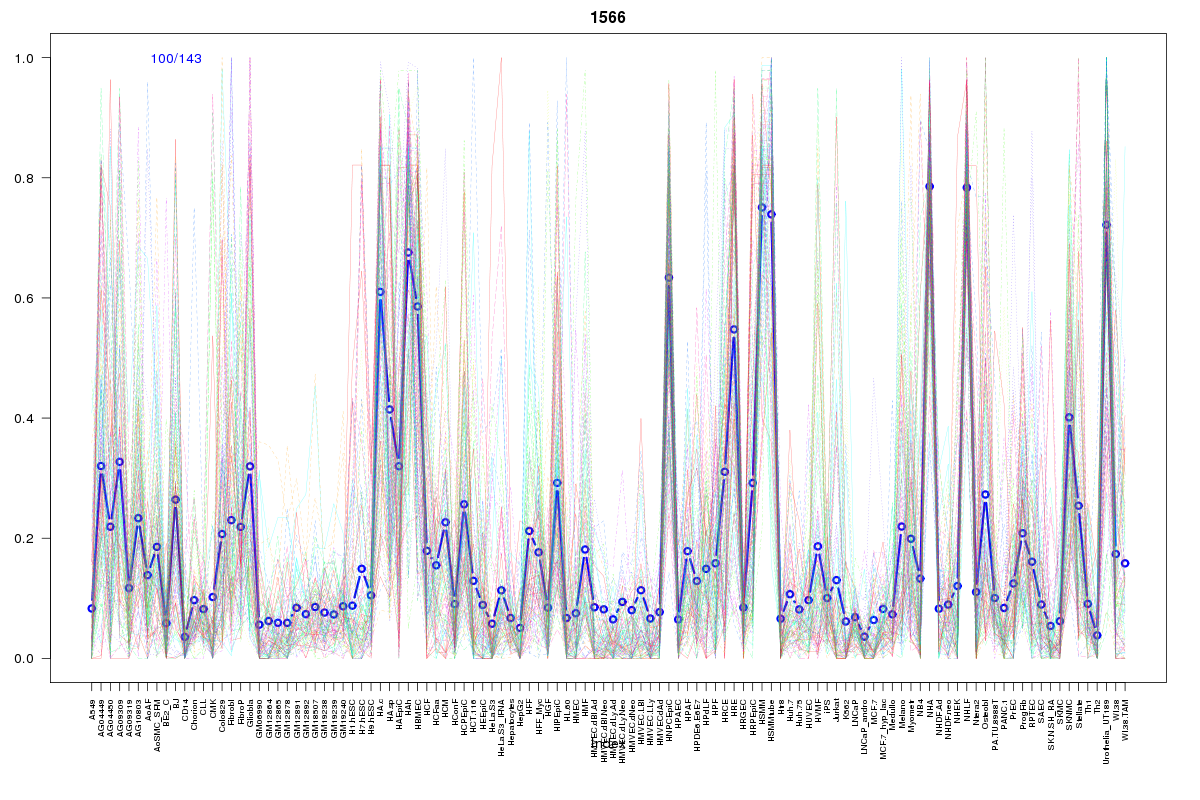
Cluster Hypersensitivity Profile

Genomic Location Trend
These plots show the distribution of the DHS sites surrounding the Transcript Start Site of the nearest gene.
Stats
Number of sites: 143Promoter: 3%
CpG-Island: 0%
Conserved: 44%
Enriched Motifs & Matches
Match Detail: [Jaspar]
|
| ||
|---|---|---|
| Sites: 70/100 | e-val: 8.1e-19 | ||
| Factor | e-val(match) | DB |
| RUNX1 | 0.00000000055889 | JASPAR |
| ZNF354C | 0.00265 | JASPAR |
| CREB1 | 0.012298 | JASPAR |
| MYC::MAX | 0.01372 | JASPAR |
| RREB1 | 0.016064 | JASPAR |
BED file downloads
Top 10 Example Regions
| Location | Gene Link | Dist. |
|---|---|---|
| chr8: 124532505-124532655 | FBXO32 | 26.71 |
| chr2: 1690600-1690750 | AC144450.2 | 62.44 |
| chr8: 18666400-18666550 | RPL35P6 | 67.25 |
| chr8: 18666400-18666550 | PSD3 | 67.25 |
| chr5: 5316580-5316730 | ADAMTS16 | 69.58 |
| chr4: 186510300-186510450 | PDLIM3 | 73.54 |
| chr16: 56946180-56946330 | RPS24P17 | 74.16 |
| chr22: 27619780-27619930 | RP5-1172A22.1 | 74.89 |
| chr22: 27619780-27619930 | CTA-929C8.6 | 74.89 |
| chr21: 47715440-47715590 | YBEY | 78.46 |