SOM cluster: 157
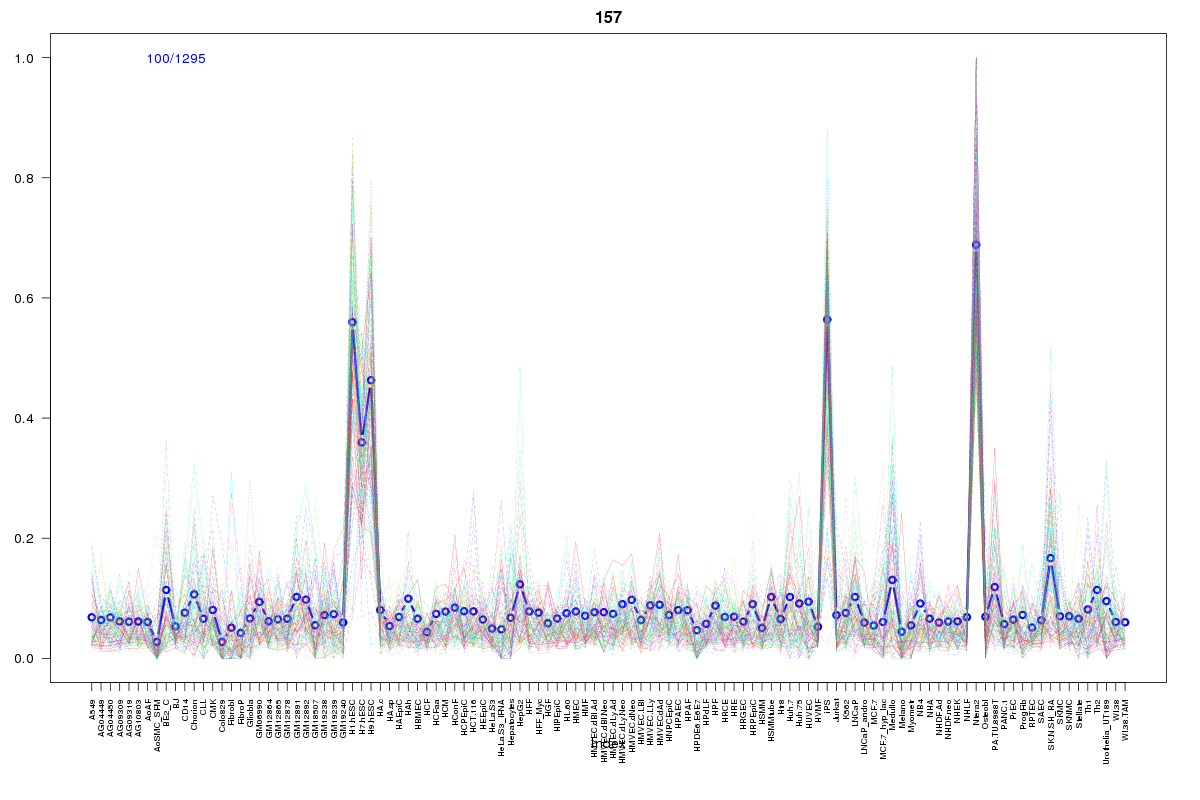
Cluster Hypersensitivity Profile

Genomic Location Trend
These plots show the distribution of the DHS sites surrounding the Transcript Start Site of the nearest gene.
Stats
Number of sites: 1295Promoter: 6%
CpG-Island: 18%
Conserved: 47%
Enriched Motifs & Matches
Match Detail: [Jaspar]
|
| ||
|---|---|---|
| Sites: 71/100 | e-val: 0 | ||
| Factor | e-val(match) | DB |
| SP1 | 0.000000000064416 | JASPAR |
| Pax4 | 0.0000013261 | JASPAR |
| Klf4 | 0.0005544 | JASPAR |
| RXR::RAR_DR5 | 0.0017637 | JASPAR |
| Tal1::Gata1 | 0.0026247 | JASPAR |
|
| ||
| Sites: 57/100 | e-val: 0.000000000000011 | ||
| Factor | e-val(match) | DB |
| SP1 | 0.000030987 | JASPAR |
| Pax4 | 0.00090708 | JASPAR |
| ZNF354C | 0.0079375 | JASPAR |
| Myf | 0.0091027 | JASPAR |
| MZF1_1-4 | 0.023457 | JASPAR |
|
| ||
| Sites: 40/100 | e-val: 0.0017 | ||
| Factor | e-val(match) | DB |
| SP1 | 0.0000033089 | JASPAR |
| EWSR1-FLI1 | 0.00011715 | JASPAR |
| TFAP2A | 0.0010134 | JASPAR |
| SPI1 | 0.003023 | JASPAR |
| Stat3 | 0.0040077 | JASPAR |
BED file downloads
Top 10 Example Regions
| Location | Gene Link | Dist. |
|---|---|---|
| chr1: 150229140-150229290 | CA14 | 13.02 |
| chr1: 150228760-150228910 | PRPF3 | 16.92 |
| chr1: 150228760-150228910 | MRPS21 | 16.92 |
| chr1: 150524380-150524530 | TARS2 | 29.91 |
| chr12: 7795500-7795650 | RP11-444J21.2 | 36.46 |
| chr12: 7795500-7795650 | GDF3 | 36.46 |
| chr11: 63827265-63827415 | RP11-21A7A.3 | 38.21 |
| chr9: 79629645-79629795 | FOXB2 | 40.44 |
| chr16: 15695185-15695335 | KIAA0430 | 41.03 |
| chr19: 29610585-29610735 | UQCRFS1 | 41.24 |