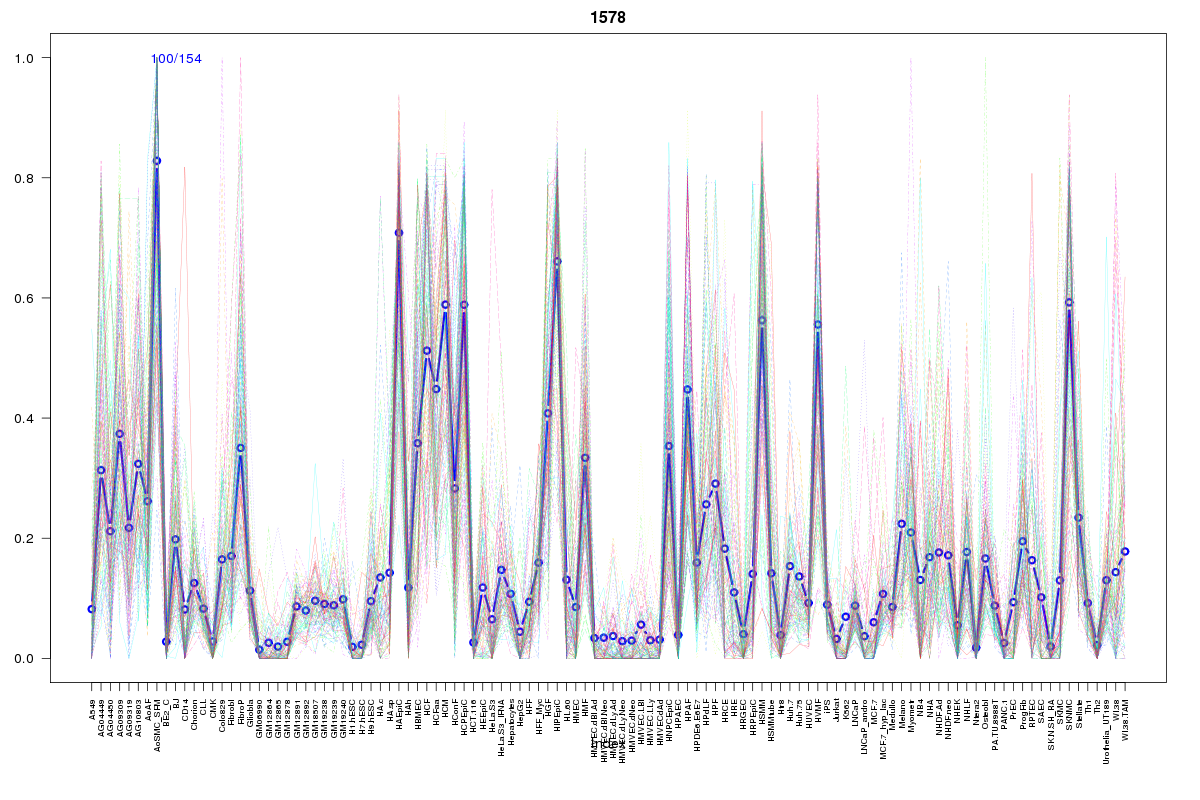
SOM cluster: 1578
Cluster Hypersensitivity Profile

Genomic Location Trend
These plots show the distribution of the DHS sites surrounding the Transcript Start Site of the nearest gene.
Stats
Number of sites: 154Promoter: 4%
CpG-Island: 0%
Conserved: 22%
Enriched Motifs & Matches
Match Detail: [Jaspar]
|
| ||
|---|---|---|
| Sites: 43/100 | e-val: 0.0000043 | ||
| Factor | e-val(match) | DB |
| CEBPA | 0.00035769 | JASPAR |
| Ddit3::Cebpa | 0.0020586 | JASPAR |
| HLF | 0.0033433 | JASPAR |
| NFIL3 | 0.0088546 | JASPAR |
| REL | 0.027699 | JASPAR |
BED file downloads
Top 10 Example Regions
| Location | Gene Link | Dist. |
|---|---|---|
| chr15: 101780680-101780830 | RP11-424I19.2 | 50.18 |
| chr8: 102085940-102086090 | RP11-302J23.1 | 50.33 |
| chr4: 129268760-129268910 | PGRMC2 | 57.88 |
| chr4: 129268760-129268910 | RP11-420A23.1 | 57.88 |
| chr2: 161231680-161231830 | RBMS1 | 60.24 |
| chr3: 154935500-154935650 | MME | 61.82 |
| chr6: 80130960-80131110 | LCA5 | 64.72 |
| chr6: 80130960-80131110 | RP1-232L24.3 | 64.72 |
| chr4: 3124960-3125110 | HTT | 65.26 |
| chr4: 40266240-40266390 | CHRNA9 | 69.28 |