SOM cluster: 1579
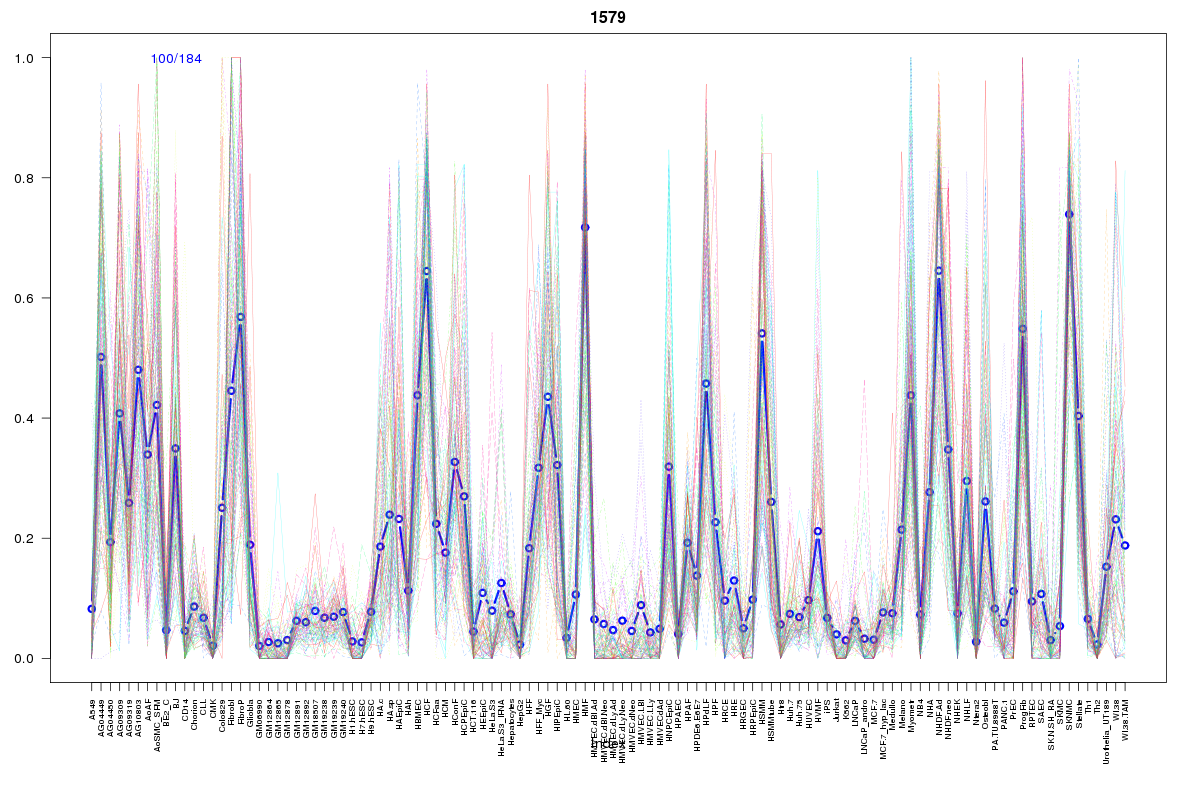
Cluster Hypersensitivity Profile

Genomic Location Trend
These plots show the distribution of the DHS sites surrounding the Transcript Start Site of the nearest gene.
Stats
Number of sites: 184Promoter: 0%
CpG-Island: 0%
Conserved: 41%
Enriched Motifs & Matches
Match Detail: [Jaspar]
|
| ||
|---|---|---|
| Sites: 34/100 | e-val: 0.000043 | ||
| Factor | e-val(match) | DB |
| AP1 | 0.00000000045733 | JASPAR |
| NFE2L2 | 0.0000000010194 | JASPAR |
| NFE2L1::MafG | 0.00047384 | JASPAR |
| Pax2 | 0.0034264 | JASPAR |
| PPARG | 0.0083317 | JASPAR |
BED file downloads
Top 10 Example Regions
| Location | Gene Link | Dist. |
|---|---|---|
| chr4: 87839800-87839950 | AFF1 | 37.34 |
| chr4: 87839800-87839950 | RP11-397E7.2 | 37.34 |
| chr14: 59922260-59922410 | GPR135 | 37.61 |
| chr8: 15363060-15363210 | TUSC3 | 44.18 |
| chr5: 98091220-98091370 | CHD1 | 48.51 |
| chr5: 98091220-98091370 | RGMB | 48.51 |
| chr5: 98091220-98091370 | RGMB-AS1 | 48.51 |
| chr3: 16770420-16770570 | AC091493.2 | 52.6 |
| chr7: 55092620-55092770 | EGFR | 52.79 |
| chr8: 93026360-93026510 | RUNX1T1 | 54.14 |