SOM cluster: 1585
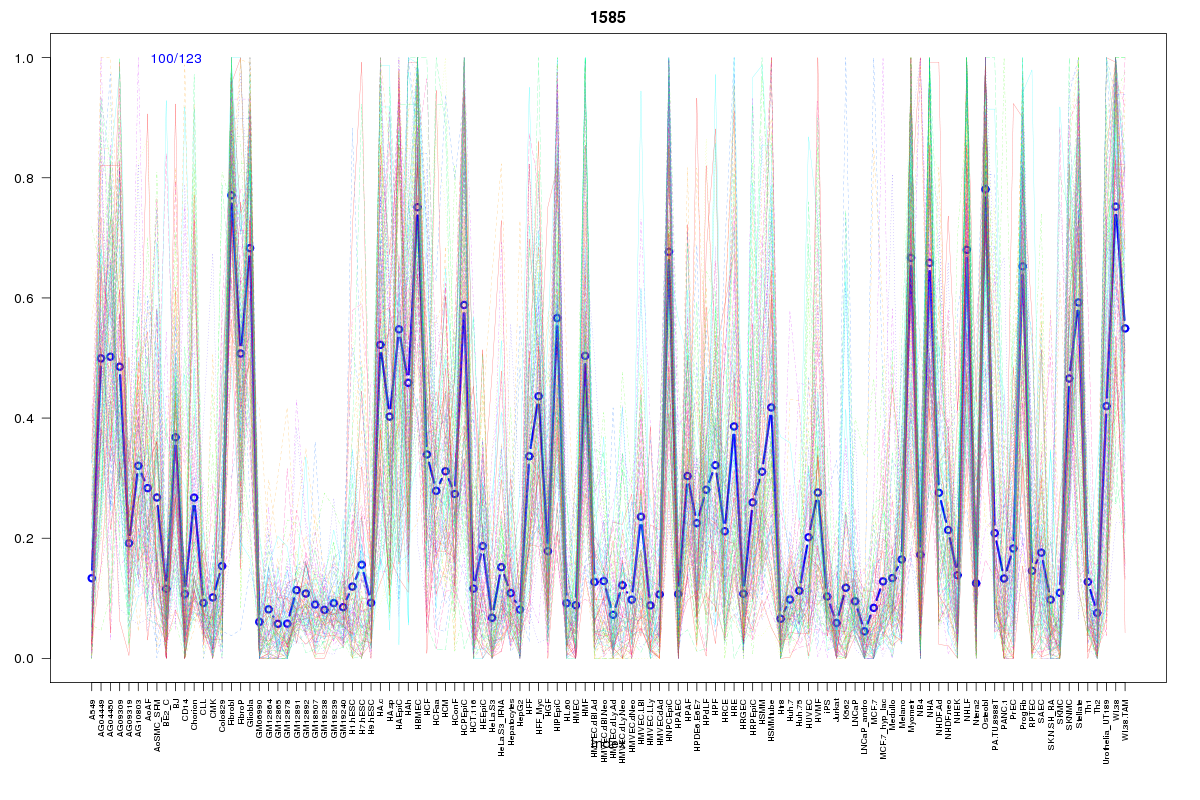
Cluster Hypersensitivity Profile

Genomic Location Trend
These plots show the distribution of the DHS sites surrounding the Transcript Start Site of the nearest gene.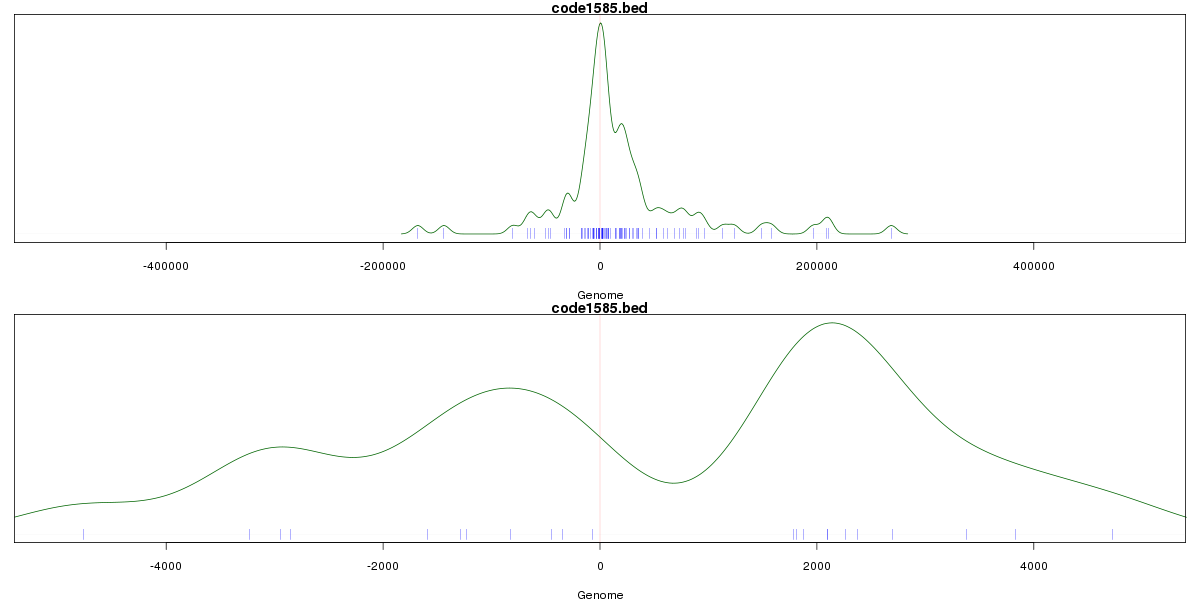
Stats
Number of sites: 123Promoter: 7%
CpG-Island: 1%
Conserved: 33%
Enriched Motifs & Matches
Match Detail: [Jaspar]
|
| ||
|---|---|---|
| Sites: 58/100 | e-val: 3.3e-31 | ||
| Factor | e-val(match) | DB |
| AP1 | 0.000000000020777 | JASPAR |
| NFE2L2 | 0.0000000058656 | JASPAR |
| PPARG | 0.0030931 | JASPAR |
| NFE2L1::MafG | 0.0050775 | JASPAR |
| Foxa2 | 0.014508 | JASPAR |
BED file downloads
Top 10 Example Regions
| Location | Gene Link | Dist. |
|---|---|---|
| chr11: 119666040-119666190 | RP11-215D10.1 | 45.87 |
| chr1: 180126060-180126210 | QSOX1 | 48.61 |
| chr2: 1679365-1679515 | PXDN | 51.92 |
| chr3: 196068140-196068290 | PCYT1A | 55.23 |
| chr3: 196068140-196068290 | RN7SL738P | 55.23 |
| chr15: 74019820-74019970 | C15orf59 | 66.47 |
| chr15: 74019820-74019970 | CD276 | 66.47 |
| chr15: 74019820-74019970 | NPTN | 66.47 |
| chr8: 637145-637295 | ERICH1 | 67.57 |
| chr8: 637145-637295 | ERICH1-AS1 | 67.57 |