SOM cluster: 1587
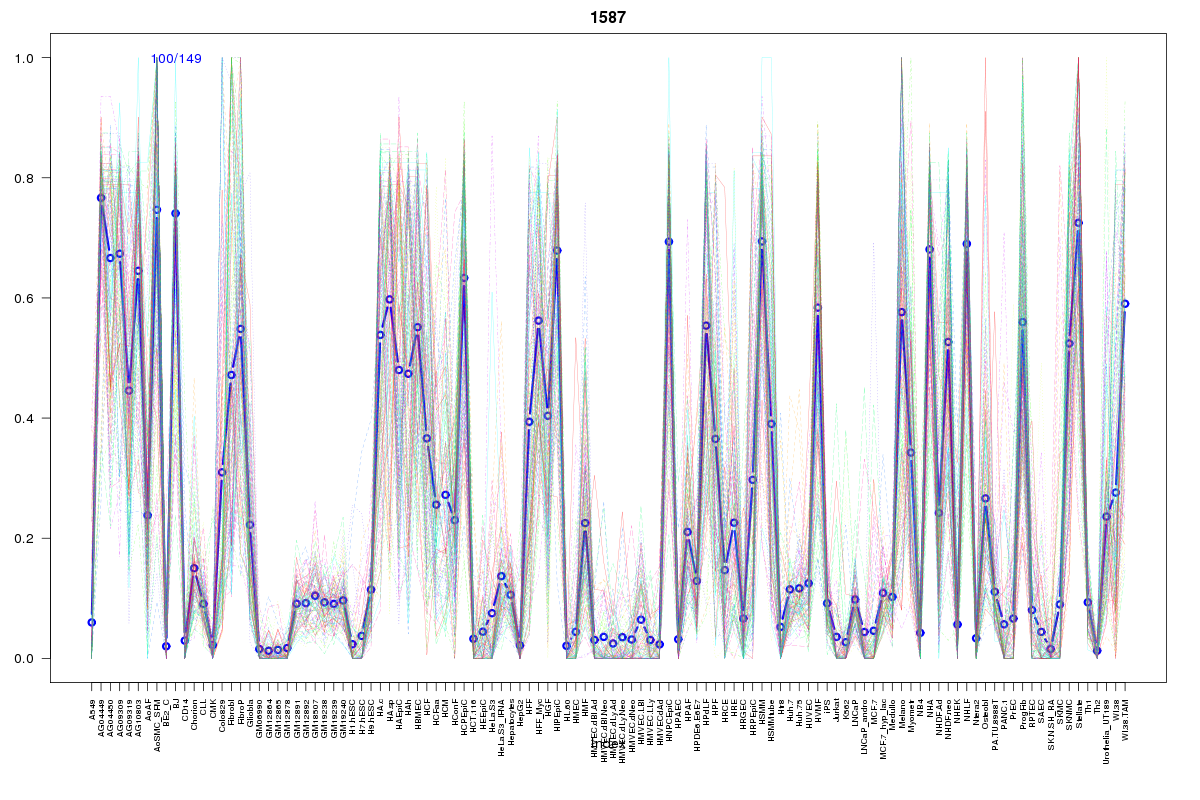
Cluster Hypersensitivity Profile

Genomic Location Trend
These plots show the distribution of the DHS sites surrounding the Transcript Start Site of the nearest gene.
Stats
Number of sites: 149Promoter: 1%
CpG-Island: 0%
Conserved: 57%
Enriched Motifs & Matches
Match Detail: [Jaspar]
|
| ||
|---|---|---|
| Sites: 41/100 | e-val: 0.0000083 | ||
| Factor | e-val(match) | DB |
| RUNX1 | 0.0000037248 | JASPAR |
| INSM1 | 0.017698 | JASPAR |
| CREB1 | 0.017841 | JASPAR |
| ZNF354C | 0.024295 | JASPAR |
| SPIB | 0.071624 | JASPAR |
BED file downloads
Top 10 Example Regions
| Location | Gene Link | Dist. |
|---|---|---|
| chr12: 49637980-49638130 | TUBA1A | 40.15 |
| chr12: 49637980-49638130 | RP11-161H23.9 | 40.15 |
| chr12: 49637980-49638130 | TROAP | 40.15 |
| chr12: 28024020-28024170 | MANSC4 | 42.66 |
| chr17: 16184760-16184910 | PIGL | 58.45 |
| chr3: 29507380-29507530 | RBMS3 | 60.76 |
| chr3: 29507380-29507530 | RPS12P5 | 60.76 |
| chr13: 110991260-110991410 | COL4A1 | 65.44 |
| chr13: 110991260-110991410 | COL4A2 | 65.44 |
| chr11: 120341960-120342110 | ARHGEF12 | 66.17 |