SOM cluster: 1592
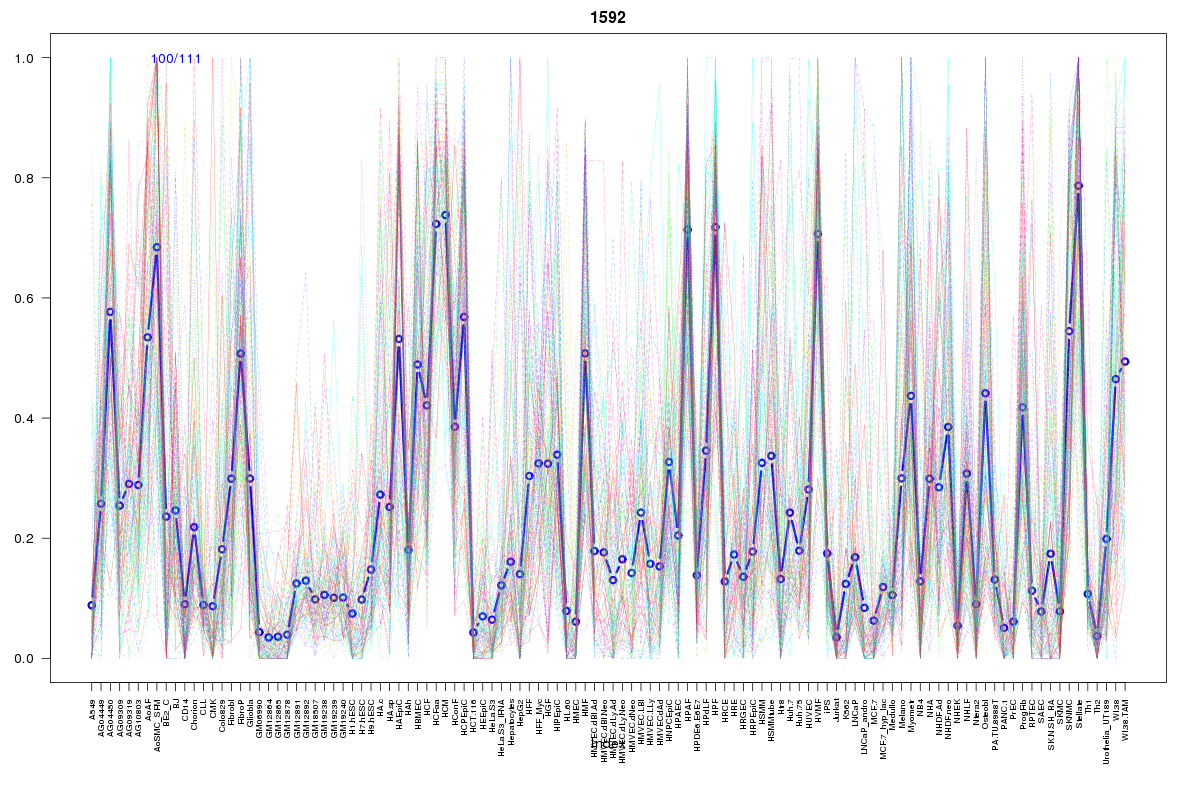
Cluster Hypersensitivity Profile

Genomic Location Trend
These plots show the distribution of the DHS sites surrounding the Transcript Start Site of the nearest gene.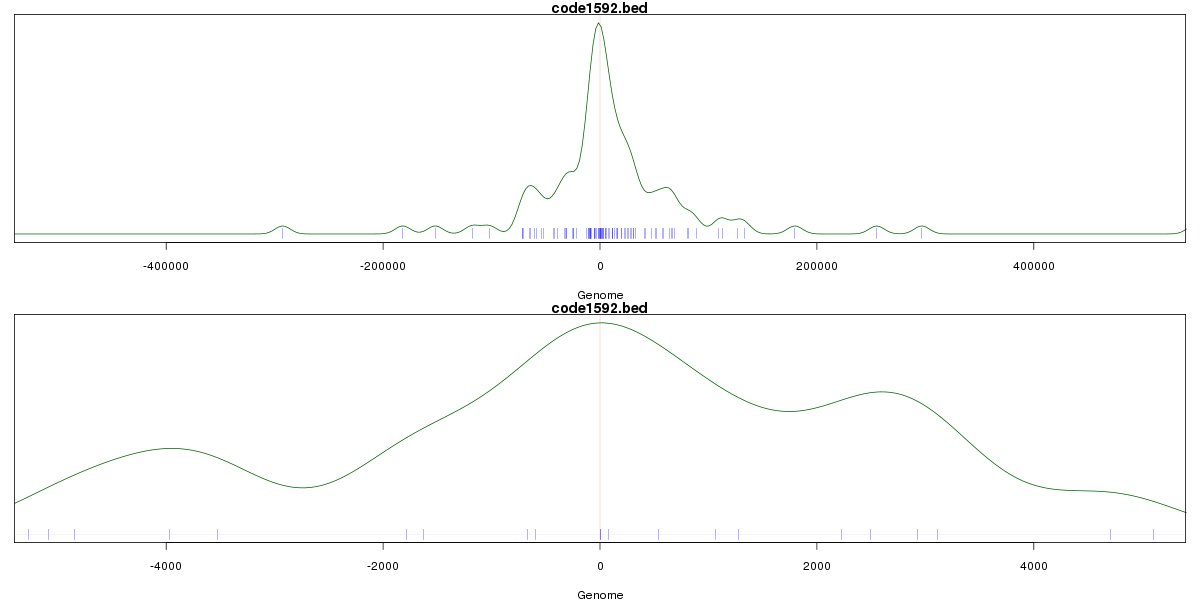
Stats
Number of sites: 111Promoter: 6%
CpG-Island: 3%
Conserved: 54%
Enriched Motifs & Matches
Match Detail: [Jaspar]
|
| ||
|---|---|---|
| Sites: 44/100 | e-val: 0.000000023 | ||
| Factor | e-val(match) | DB |
| SP1 | 0.0000017087 | JASPAR |
| RREB1 | 0.0000022773 | JASPAR |
| Pax4 | 0.00013386 | JASPAR |
| EWSR1-FLI1 | 0.00050042 | JASPAR |
| Tal1::Gata1 | 0.0051891 | JASPAR |
|
| ||
| Sites: 29/100 | e-val: 0.099 | ||
| Factor | e-val(match) | DB |
| TLX1::NFIC | 0.0000026132 | JASPAR |
| INSM1 | 0.00004793 | JASPAR |
| EWSR1-FLI1 | 0.000063963 | JASPAR |
| TFAP2A | 0.0017864 | JASPAR |
| SP1 | 0.0092579 | JASPAR |
BED file downloads
Top 10 Example Regions
| Location | Gene Link | Dist. |
|---|---|---|
| chr8: 49467800-49467950 | AC026904.1 | 50.29 |
| chr8: 49467800-49467950 | RP11-770E5.1 | 50.29 |
| chr8: 49467800-49467950 | RP11-567J20.2 | 50.29 |
| chr12: 89478660-89478810 | RP11-13A1.1 | 56.89 |
| chr1: 2207400-2207550 | PRKCZ | 61.26 |
| chrX: 11369900-11370050 | ARHGAP6 | 63.17 |
| chr7: 47366460-47366610 | TNS3 | 63.26 |
| chr1: 214843560-214843710 | CENPF | 63.42 |
| chr11: 118476465-118476615 | PHLDB1 | 64.85 |
| chr11: 118476465-118476615 | AP002954.6 | 64.85 |