SOM cluster: 1604
Cluster Hypersensitivity Profile

Genomic Location Trend
These plots show the distribution of the DHS sites surrounding the Transcript Start Site of the nearest gene.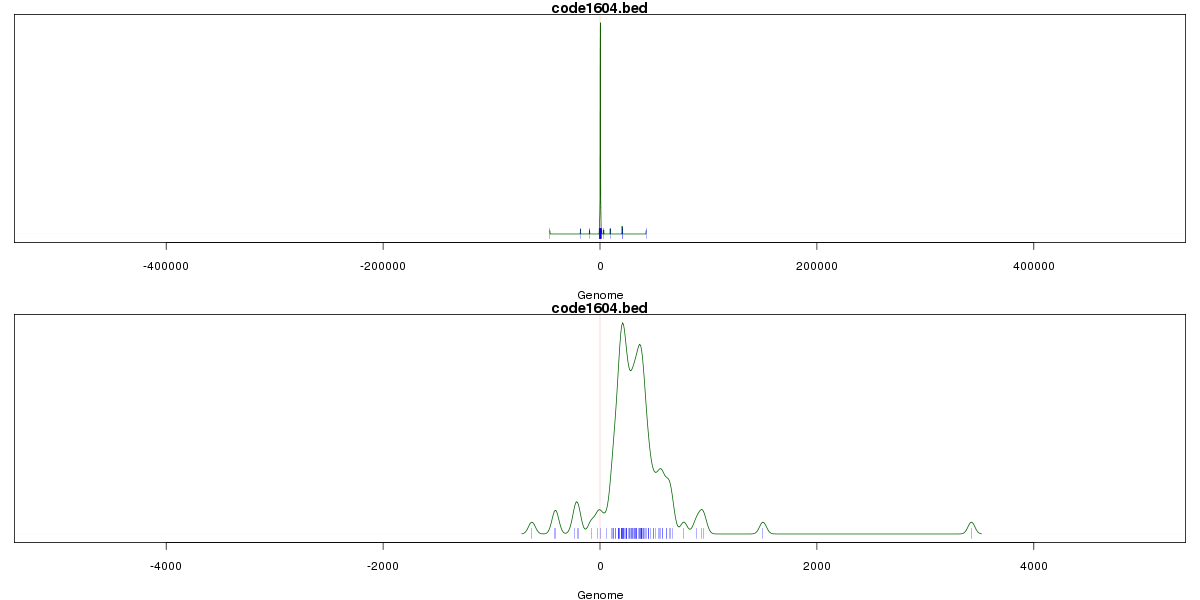
Stats
Number of sites: 751Promoter: 18%
CpG-Island: 87%
Conserved: 64%
Enriched Motifs & Matches
Match Detail: [Jaspar]
|
| ||
|---|---|---|
| Sites: 96/100 | e-val: 0 | ||
| Factor | e-val(match) | DB |
| SP1 | 0.0000011017 | JASPAR |
| TFAP2A | 0.00040949 | JASPAR |
| RREB1 | 0.00059976 | JASPAR |
| Klf4 | 0.0019547 | JASPAR |
| PLAG1 | 0.0051361 | JASPAR |
|
| ||
| Sites: 89/100 | e-val: 0 | ||
| Factor | e-val(match) | DB |
| SP1 | 0.00000044393 | JASPAR |
| TFAP2A | 0.000046834 | JASPAR |
| PLAG1 | 0.00047592 | JASPAR |
| Klf4 | 0.013004 | JASPAR |
| MZF1_1-4 | 0.018293 | JASPAR |
|
| ||
| Sites: 67/100 | e-val: 0.00000000042 | ||
| Factor | e-val(match) | DB |
| SP1 | 0.00000000083834 | JASPAR |
| Klf4 | 0.00076515 | JASPAR |
| NFKB1 | 0.0010279 | JASPAR |
| Zfx | 0.012633 | JASPAR |
| TFAP2A | 0.02099 | JASPAR |
BED file downloads
Top 10 Example Regions
| Location | Gene Link | Dist. |
|---|---|---|
| chr7: 155089765-155089915 | AC008060.7 | 37.6 |
| chr7: 45001725-45001875 | MYO1G | 38.63 |
| chr22: 22336885-22337035 | IGLV10-67 | 42.59 |
| chr22: 22336885-22337035 | IGLVIV-66-1 | 42.59 |
| chr17: 72209805-72209955 | DNAI2 | 44.72 |
| chr11: 125439560-125439710 | EI24 | 45.29 |
| chr1: 156720700-156720850 | CRABP2 | 45.58 |
| chr22: 21336820-21336970 | P2RX6 | 46.28 |
| chr22: 21336820-21336970 | XXbac-B135H6.15 | 46.28 |
| chr12: 49372005-49372155 | PRKAG1 | 46.76 |