SOM cluster: 1610
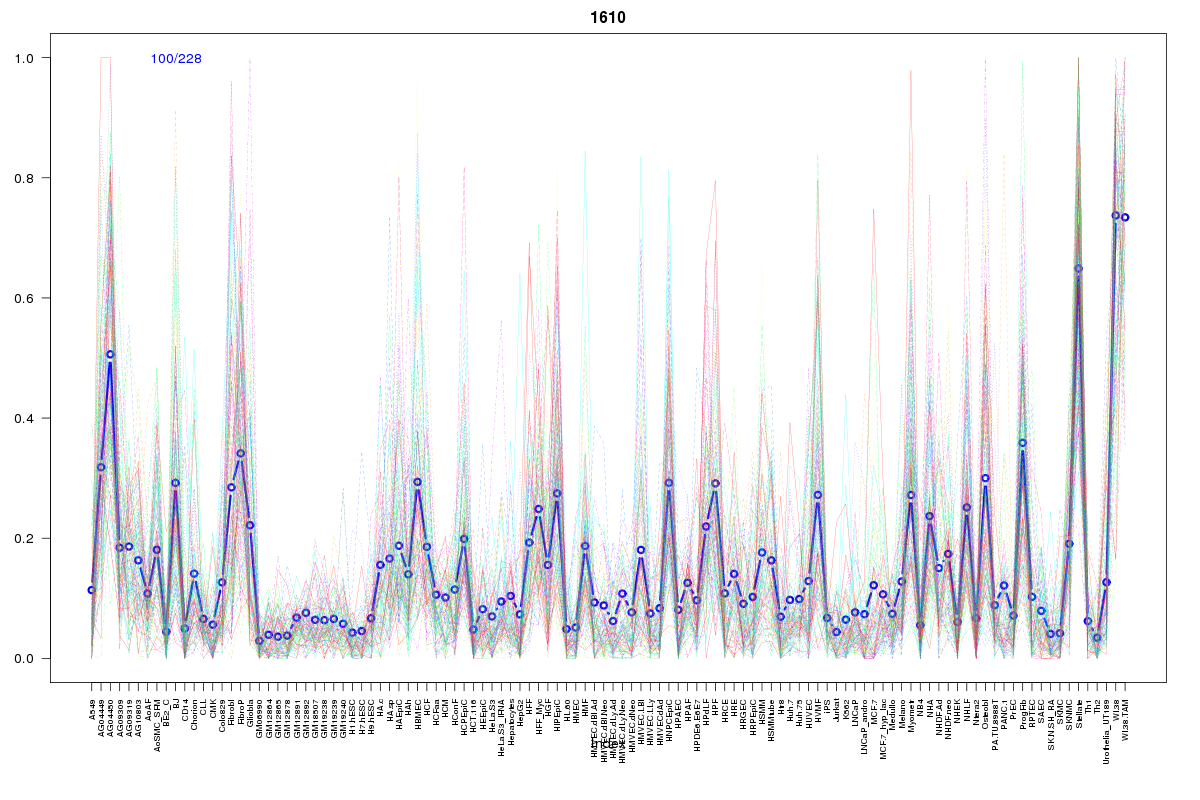
Cluster Hypersensitivity Profile

Genomic Location Trend
These plots show the distribution of the DHS sites surrounding the Transcript Start Site of the nearest gene.
Stats
Number of sites: 228Promoter: 0%
CpG-Island: 0%
Conserved: 24%
Enriched Motifs & Matches
Match Detail: [Jaspar]
|
| ||
|---|---|---|
| Sites: 28/100 | e-val: 0.21 | ||
| Factor | e-val(match) | DB |
| Foxd3 | 0.0000000018318 | JASPAR |
| Foxq1 | 0.000000013831 | JASPAR |
| FOXI1 | 0.000017928 | JASPAR |
| FOXA1 | 0.000076043 | JASPAR |
| Foxa2 | 0.00015767 | JASPAR |
|
| ||
| Sites: 28/100 | e-val: 0.047 | ||
| Factor | e-val(match) | DB |
| AP1 | 0.000000000043367 | JASPAR |
| NFE2L2 | 0.0000000043123 | JASPAR |
| PPARG | 0.0040545 | JASPAR |
| NFE2L1::MafG | 0.0047882 | JASPAR |
| Foxa2 | 0.018617 | JASPAR |
BED file downloads
Top 10 Example Regions
| Location | Gene Link | Dist. |
|---|---|---|
| chr8: 16963680-16963830 | MICU3 | 48.48 |
| chr8: 16963680-16963830 | RP11-468H14.2 | 48.48 |
| chr5: 266560-266710 | AHRR | 51.4 |
| chr11: 122542420-122542570 | UBASH3B | 51.85 |
| chr2: 74227460-74227610 | ACTG2 | 53.25 |
| chr12: 72667080-72667230 | TRHDE | 53.48 |
| chr12: 72667080-72667230 | TRHDE-AS1 | 53.48 |
| chr5: 132157700-132157850 | CCNI2 | 59.19 |
| chr5: 132157700-132157850 | GDF9 | 59.19 |
| chr1: 26036540-26036690 | MAN1C1 | 60.08 |