SOM cluster: 1613
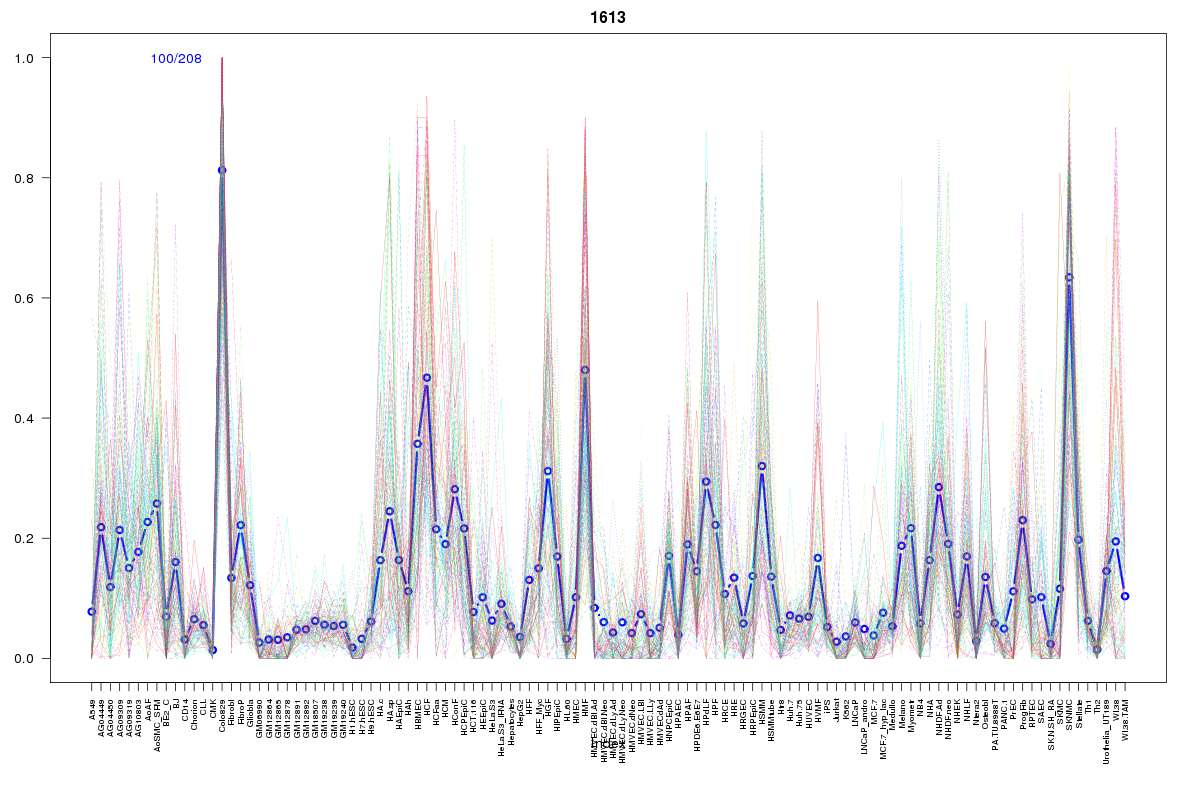
Cluster Hypersensitivity Profile

Genomic Location Trend
These plots show the distribution of the DHS sites surrounding the Transcript Start Site of the nearest gene.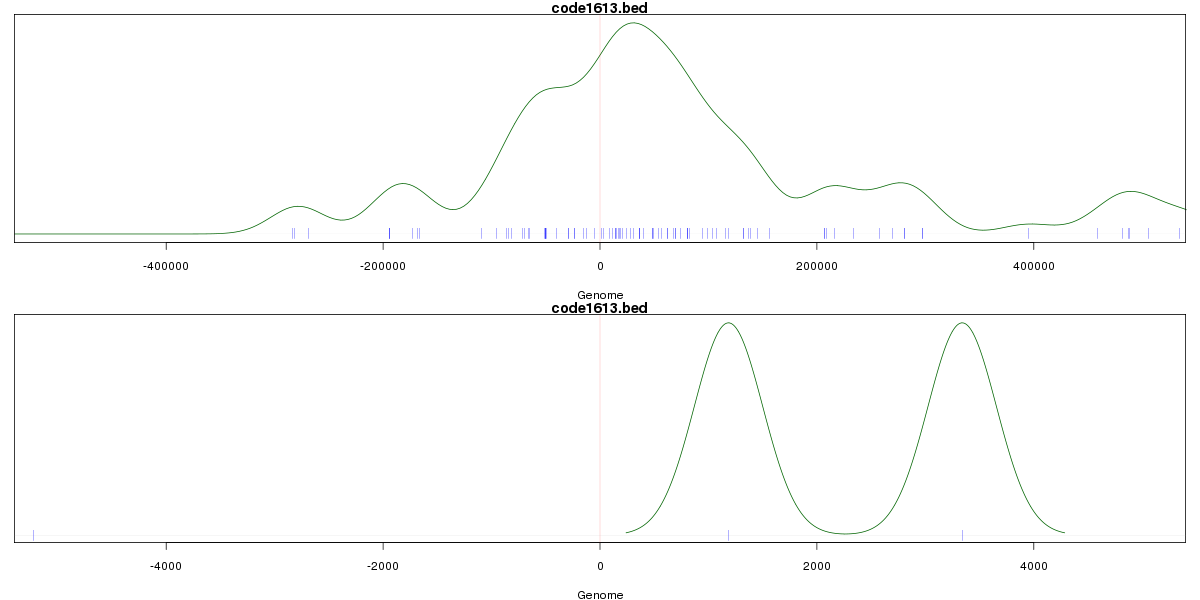
Stats
Number of sites: 208Promoter: 0%
CpG-Island: 0%
Conserved: 49%
Enriched Motifs & Matches
Match Detail: [Jaspar]
|
| ||
|---|---|---|
| Sites: 47/100 | e-val: 0.0000000000000095 | ||
| Factor | e-val(match) | DB |
| AP1 | 0.0000003445 | JASPAR |
| NFE2L2 | 0.000070553 | JASPAR |
| Lhx3 | 0.00017841 | JASPAR |
| HNF1A | 0.00057584 | JASPAR |
| PBX1 | 0.0074211 | JASPAR |
|
| ||
| Sites: 35/100 | e-val: 0.0000000000027 | ||
| Factor | e-val(match) | DB |
| EBF1 | 0.0000000000084179 | JASPAR |
| PLAG1 | 0.000047059 | JASPAR |
| Zfp423 | 0.0012212 | JASPAR |
| NF-kappaB | 0.0018329 | JASPAR |
| RELA | 0.0059347 | JASPAR |
BED file downloads
Top 10 Example Regions
| Location | Gene Link | Dist. |
|---|---|---|
| chr7: 134158660-134158810 | AKR1B1 | 35.18 |
| chr7: 134158660-134158810 | AKR1B10 | 35.18 |
| chr7: 134158660-134158810 | AKR1B15 | 35.18 |
| chr5: 75900800-75900950 | IQGAP2 | 36.99 |
| chr5: 75900800-75900950 | CTD-2384B11.2 | 36.99 |
| chr12: 89058980-89059130 | KITLG | 43.88 |
| chrX: 144833580-144833730 | SLITRK2 | 44.04 |
| chrX: 13863920-13864070 | GPM6B | 56.03 |
| chr7: 42195920-42196070 | GLI3 | 56.32 |
| chr1: 183066440-183066590 | LAMC1 | 65.08 |