SOM cluster: 1619
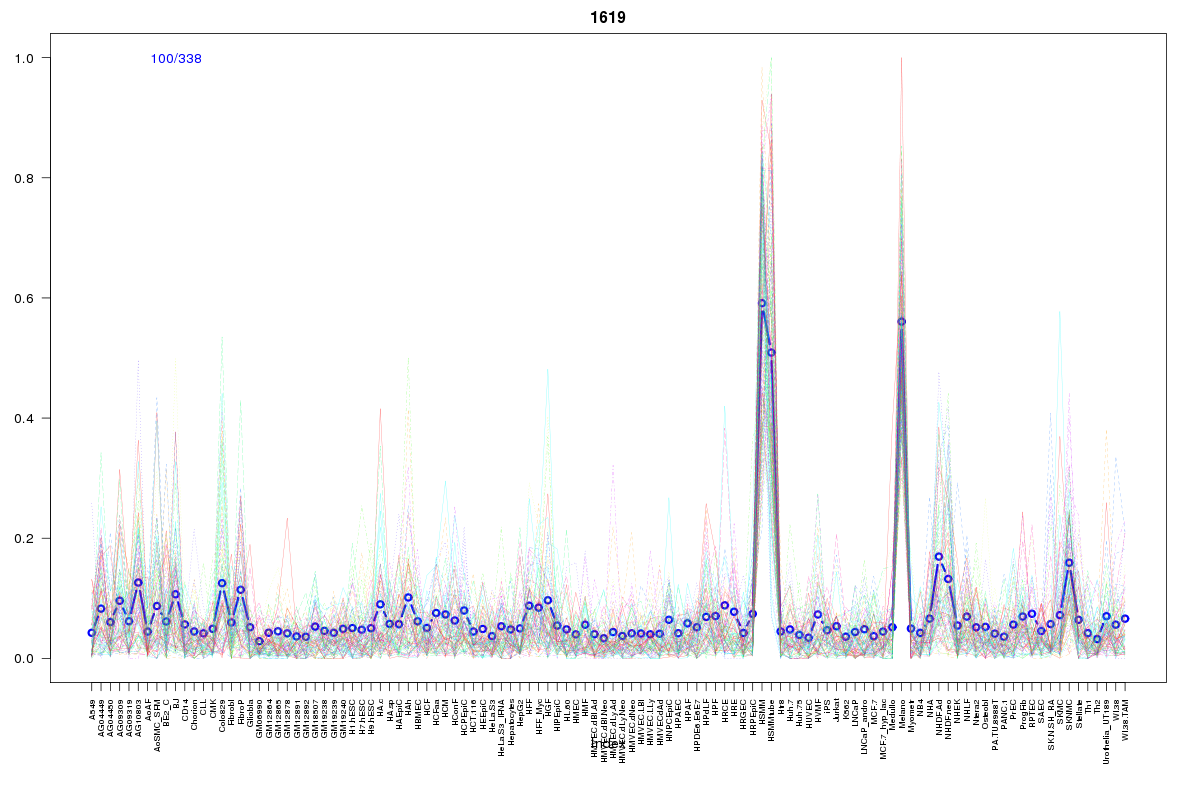
Cluster Hypersensitivity Profile

Genomic Location Trend
These plots show the distribution of the DHS sites surrounding the Transcript Start Site of the nearest gene.
Stats
Number of sites: 338Promoter: 2%
CpG-Island: 0%
Conserved: 49%
Enriched Motifs & Matches
Match Detail: [Jaspar]
|
| ||
|---|---|---|
| Sites: 56/100 | e-val: 1.3e-19 | ||
| Factor | e-val(match) | DB |
| Myf | 0.00000099361 | JASPAR |
| TAL1::TCF3 | 0.0000016658 | JASPAR |
| NHLH1 | 0.0000048484 | JASPAR |
| Spz1 | 0.00054266 | JASPAR |
| Myb | 0.0025663 | JASPAR |
|
| ||
| Sites: 21/100 | e-val: 0.32 | ||
| Factor | e-val(match) | DB |
| TEAD1 | 0.00019292 | JASPAR |
| Stat3 | 0.00064058 | JASPAR |
| NFATC2 | 0.0040429 | JASPAR |
| ELK4 | 0.014026 | JASPAR |
| HOXA5 | 0.01471 | JASPAR |
BED file downloads
Top 10 Example Regions
| Location | Gene Link | Dist. |
|---|---|---|
| chr16: 87892320-87892470 | CA5A | 52.35 |
| chr1: 154509160-154509310 | ADAR | 65.95 |
| chr1: 154509160-154509310 | UBE2Q1 | 65.95 |
| chr15: 79540640-79540790 | ANKRD34C | 74.18 |
| chr17: 48508180-48508330 | MRPL27 | 76.02 |
| chr15: 33427585-33427735 | FMN1 | 80.44 |
| chr22: 28358565-28358715 | PITPNB | 81 |
| chr12: 54358260-54358410 | HOXC10 | 81.75 |
| chr12: 54358260-54358410 | HOXC6 | 81.75 |
| chr12: 54358260-54358410 | HOTAIR | 81.75 |