SOM cluster: 1644
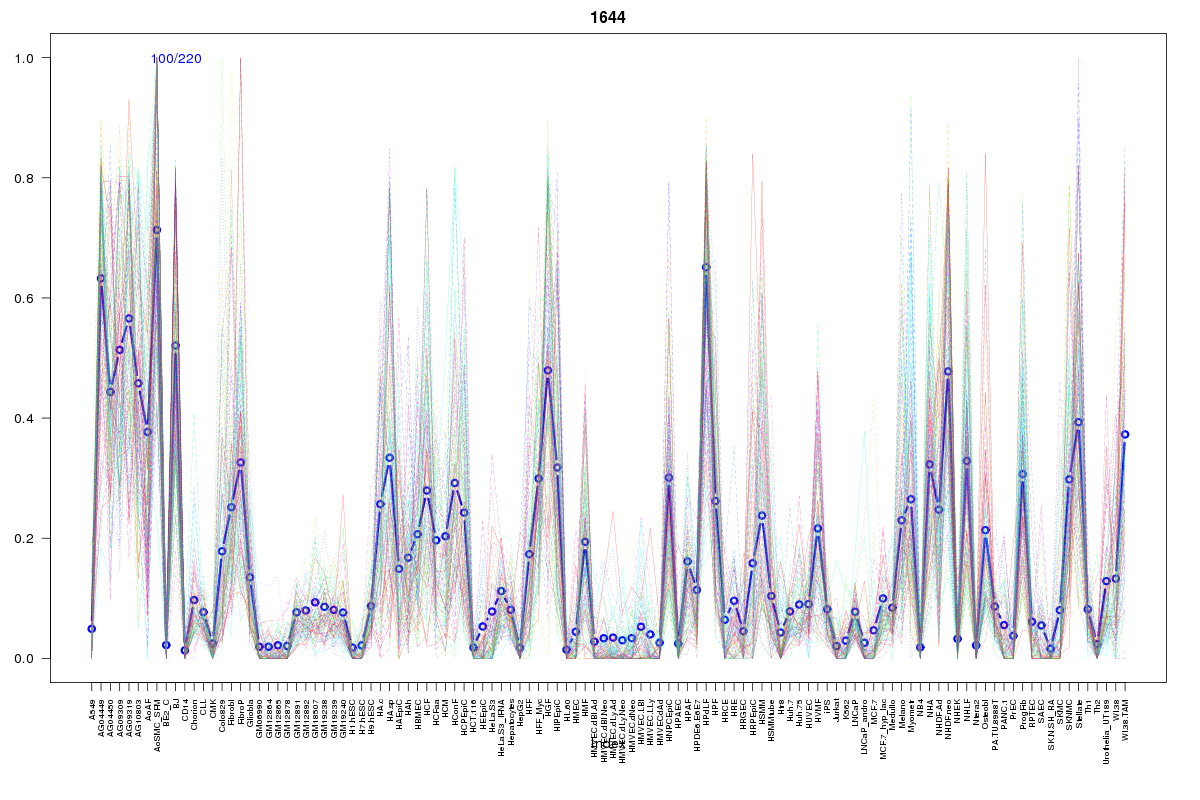
Cluster Hypersensitivity Profile

Genomic Location Trend
These plots show the distribution of the DHS sites surrounding the Transcript Start Site of the nearest gene.
Stats
Number of sites: 220Promoter: 3%
CpG-Island: 0%
Conserved: 56%
Enriched Motifs & Matches
Match Detail: [Jaspar]
|
| ||
|---|---|---|
| Sites: 57/100 | e-val: 3.1e-24 | ||
| Factor | e-val(match) | DB |
| Foxd3 | 0.000062681 | JASPAR |
| Lhx3 | 0.0007868 | JASPAR |
| NKX3-1 | 0.0011901 | JASPAR |
| Pou5f1 | 0.002161 | JASPAR |
| FOXA1 | 0.0025879 | JASPAR |
|
| ||
| Sites: 23/100 | e-val: 0.51 | ||
| Factor | e-val(match) | DB |
| NKX3-1 | 0.0042563 | JASPAR |
| FOXO3 | 0.0046841 | JASPAR |
| NR3C1 | 0.0071942 | JASPAR |
| Foxd3 | 0.0089932 | JASPAR |
| NFATC2 | 0.011081 | JASPAR |
|
| ||
| Sites: 25/100 | e-val: 0.53 | ||
| Factor | e-val(match) | DB |
| HOXA5 | 0.00041507 | JASPAR |
| HNF1A | 0.000937 | JASPAR |
| ARID3A | 0.0046777 | JASPAR |
| NF-kappaB | 0.0054201 | JASPAR |
| Lhx3 | 0.006531 | JASPAR |
BED file downloads
Top 10 Example Regions
| Location | Gene Link | Dist. |
|---|---|---|
| chr3: 132325060-132325210 | NPHP3 | 37.56 |
| chr3: 132325060-132325210 | ACAD11 | 37.56 |
| chr12: 105650960-105651110 | APPL2 | 52.91 |
| chr12: 105650960-105651110 | C12orf75 | 52.91 |
| chr13: 20413065-20413215 | PSPC1 | 53.28 |
| chr6: 132182640-132182790 | RP11-69I8.3 | 53.9 |
| chr13: 99106545-99106695 | STK24 | 57.14 |
| chr13: 99106545-99106695 | FARP1 | 57.14 |
| chr8: 108414420-108414570 | ANGPT1 | 58.18 |
| chr1: 178061240-178061390 | RASAL2-AS1 | 60.78 |