SOM cluster: 1650
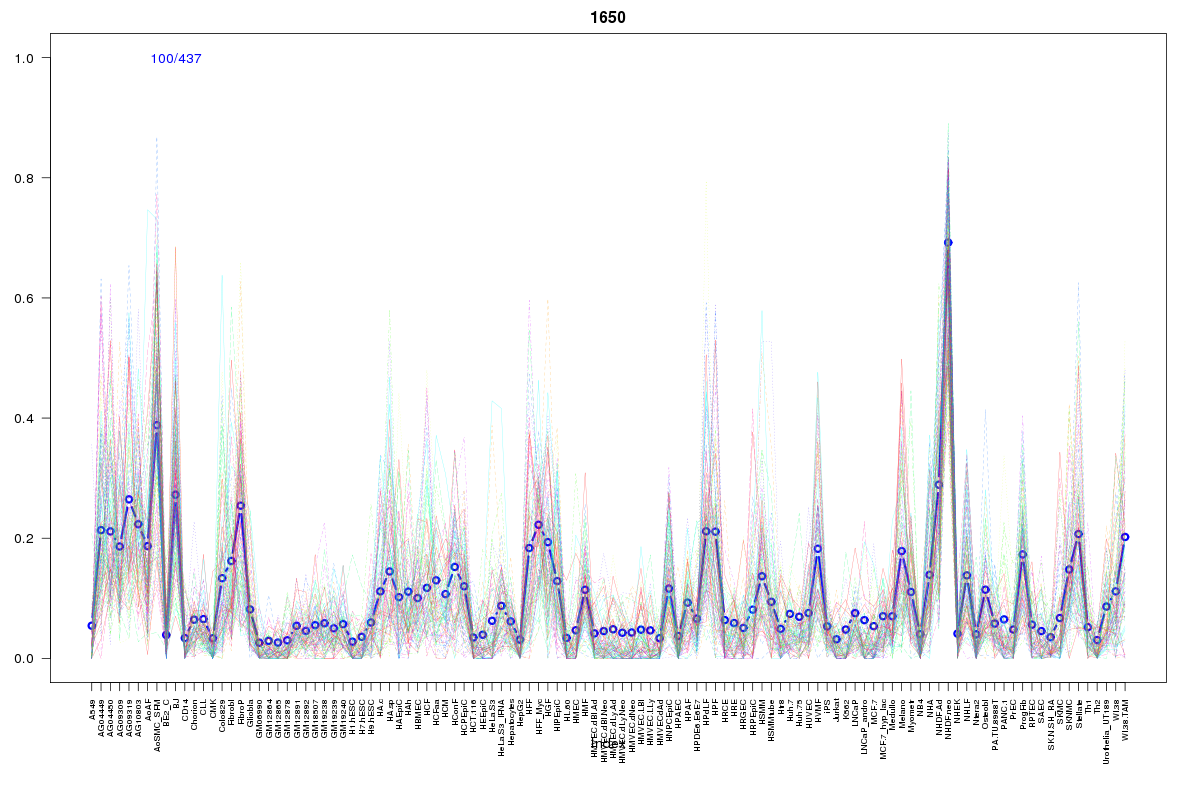
Cluster Hypersensitivity Profile

Genomic Location Trend
These plots show the distribution of the DHS sites surrounding the Transcript Start Site of the nearest gene.
Stats
Number of sites: 437Promoter: 1%
CpG-Island: 0%
Conserved: 57%
Enriched Motifs & Matches
Match Detail: [Jaspar]
|
| ||
|---|---|---|
| Sites: 50/100 | e-val: 1.3e-18 | ||
| Factor | e-val(match) | DB |
| Foxd3 | 0.000021941 | JASPAR |
| Foxa2 | 0.000073444 | JASPAR |
| FOXA1 | 0.00031179 | JASPAR |
| FOXO3 | 0.0023417 | JASPAR |
| Foxq1 | 0.0032682 | JASPAR |
BED file downloads
Top 10 Example Regions
| Location | Gene Link | Dist. |
|---|---|---|
| chr1: 92202220-92202370 | TGFBR3 | 13.27 |
| chr3: 170520105-170520255 | RPL22L1 | 47.49 |
| chr9: 137493740-137493890 | COL5A1 | 50.56 |
| chr7: 28109865-28110015 | JAZF1 | 53.17 |
| chr17: 15955900-15956050 | TTC19 | 56.97 |
| chr17: 15955900-15956050 | ZSWIM7 | 56.97 |
| chr8: 53030100-53030250 | RP11-546K22.1 | 59.54 |
| chr7: 102567000-102567150 | FBXL13 | 62.39 |
| chr3: 69974780-69974930 | MITF | 64.32 |
| chr6: 133916460-133916610 | RP3-323P13.2 | 64.86 |