SOM cluster: 1656
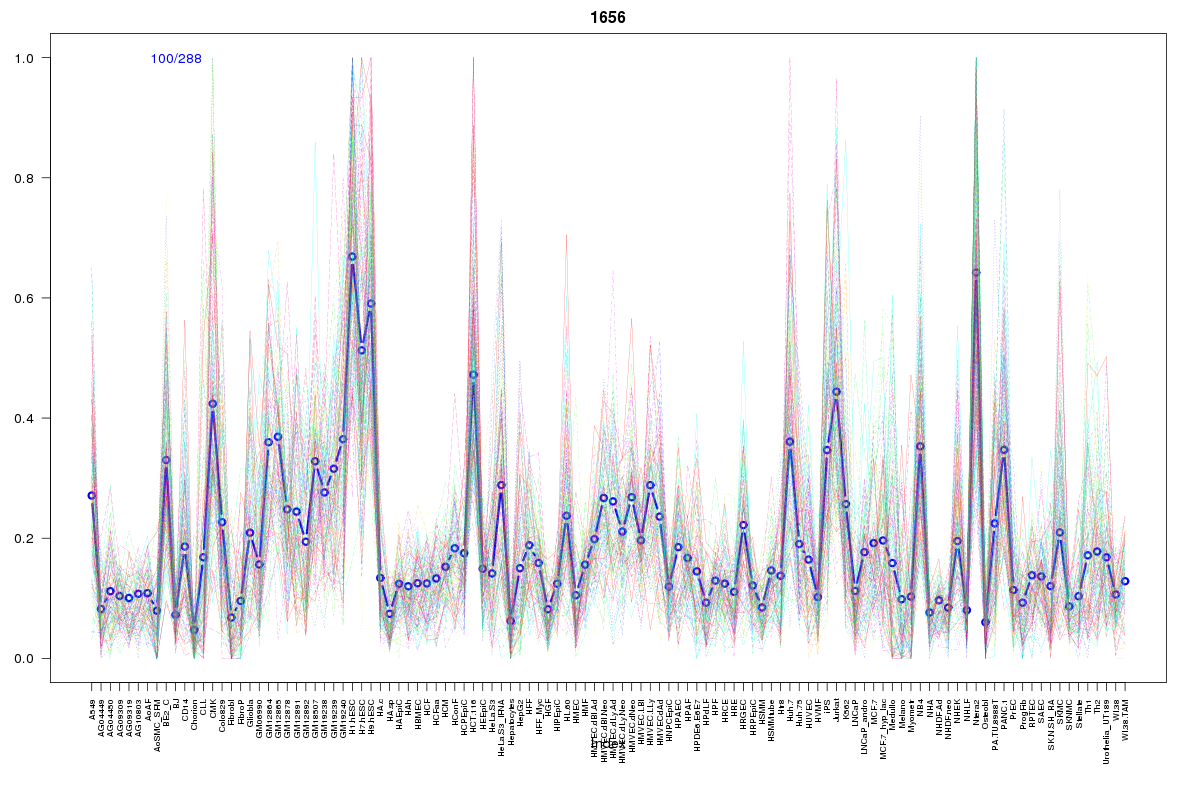
Cluster Hypersensitivity Profile

Genomic Location Trend
These plots show the distribution of the DHS sites surrounding the Transcript Start Site of the nearest gene.
Stats
Number of sites: 288Promoter: 2%
CpG-Island: 0%
Conserved: 26%
Enriched Motifs & Matches
Match Detail: [Jaspar]
|
| ||
|---|---|---|
| Sites: 56/100 | e-val: 0 | ||
| Factor | e-val(match) | DB |
| CTCF | 0 | JASPAR |
| INSM1 | 0.00000038624 | JASPAR |
| SP1 | 0.0011368 | JASPAR |
| Zfp423 | 0.001366 | JASPAR |
| MYC::MAX | 0.0064731 | JASPAR |
BED file downloads
Top 10 Example Regions
| Location | Gene Link | Dist. |
|---|---|---|
| chr3: 149205500-149205650 | RP11-278L15.4 | 32.84 |
| chr2: 29179360-29179510 | WDR43 | 39.28 |
| chrX: 130962080-130962230 | RP11-453F18__B.1 | 42.47 |
| chrX: 130962080-130962230 | RP11-512H23.2 | 42.47 |
| chr1: 30705220-30705370 | RP5-893G23.1 | 43.37 |
| chr2: 70346020-70346170 | PCBP1-AS1 | 46.29 |
| chr2: 70346020-70346170 | TIA1 | 46.29 |
| chr1: 46713920-46714070 | RAD54L | 49.99 |
| chr1: 46713920-46714070 | LURAP1 | 49.99 |
| chr1: 46713920-46714070 | UQCRH | 49.99 |