SOM cluster: 1658
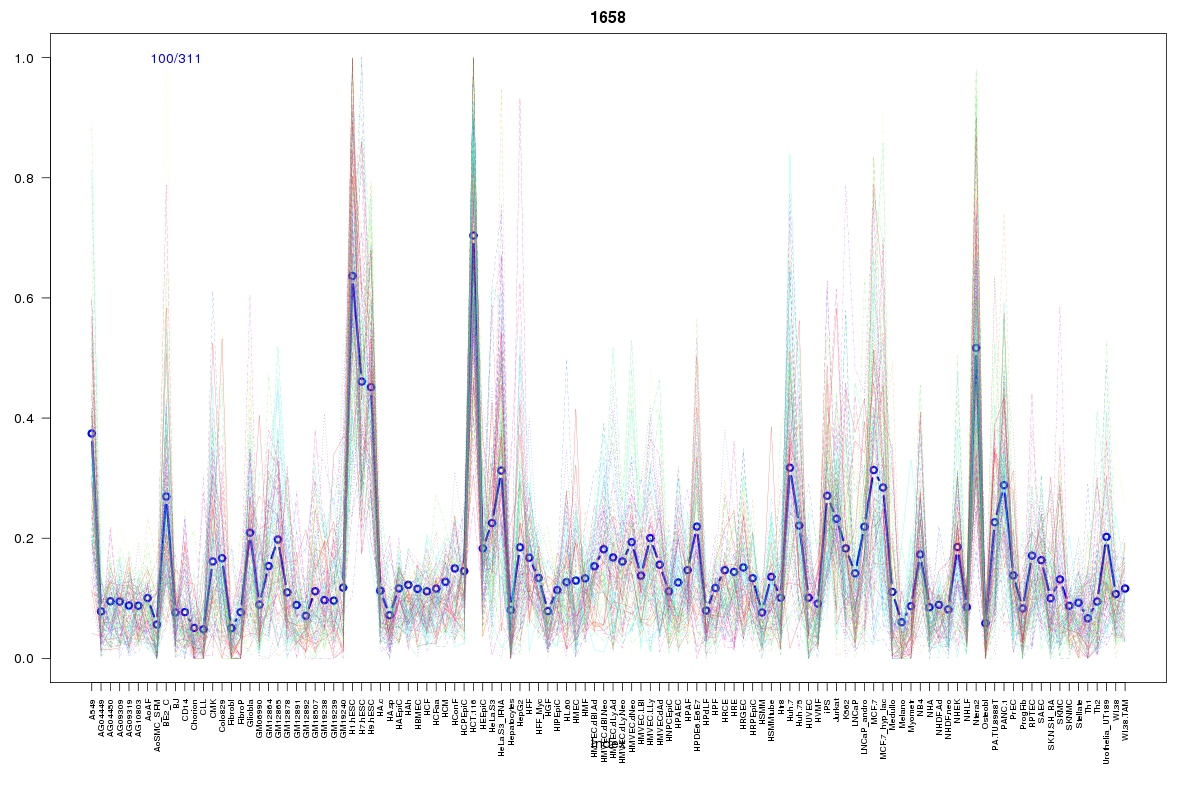
Cluster Hypersensitivity Profile

Genomic Location Trend
These plots show the distribution of the DHS sites surrounding the Transcript Start Site of the nearest gene.
Stats
Number of sites: 311Promoter: 3%
CpG-Island: 0%
Conserved: 24%
Enriched Motifs & Matches
Match Detail: [Jaspar]
|
| ||
|---|---|---|
| Sites: 47/100 | e-val: 2.1e-32 | ||
| Factor | e-val(match) | DB |
| CTCF | 0.0000000000000011102 | JASPAR |
| INSM1 | 0.0000014806 | JASPAR |
| MYC::MAX | 0.00070591 | JASPAR |
| SP1 | 0.0071757 | JASPAR |
| Zfp423 | 0.012111 | JASPAR |
BED file downloads
Top 10 Example Regions
| Location | Gene Link | Dist. |
|---|---|---|
| chr5: 38404860-38405010 | EGFLAM | 30.38 |
| chr5: 38404860-38405010 | CTD-2263F21.1 | 30.38 |
| chr8: 41278660-41278810 | KRT18P37 | 46.01 |
| chr12: 98816780-98816930 | TMPO-AS1 | 50.02 |
| chr19: 56061440-56061590 | FIZ1 | 56.04 |
| chr6: 4806320-4806470 | CDYL | 56.71 |
| chr22: 22526100-22526250 | IGLVI-63 | 57.64 |
| chr22: 22526100-22526250 | VPREB1 | 57.64 |
| chr22: 22526100-22526250 | IGLVI-56 | 57.64 |
| chr3: 160814665-160814815 | PPM1L | 60.76 |