SOM cluster: 1664
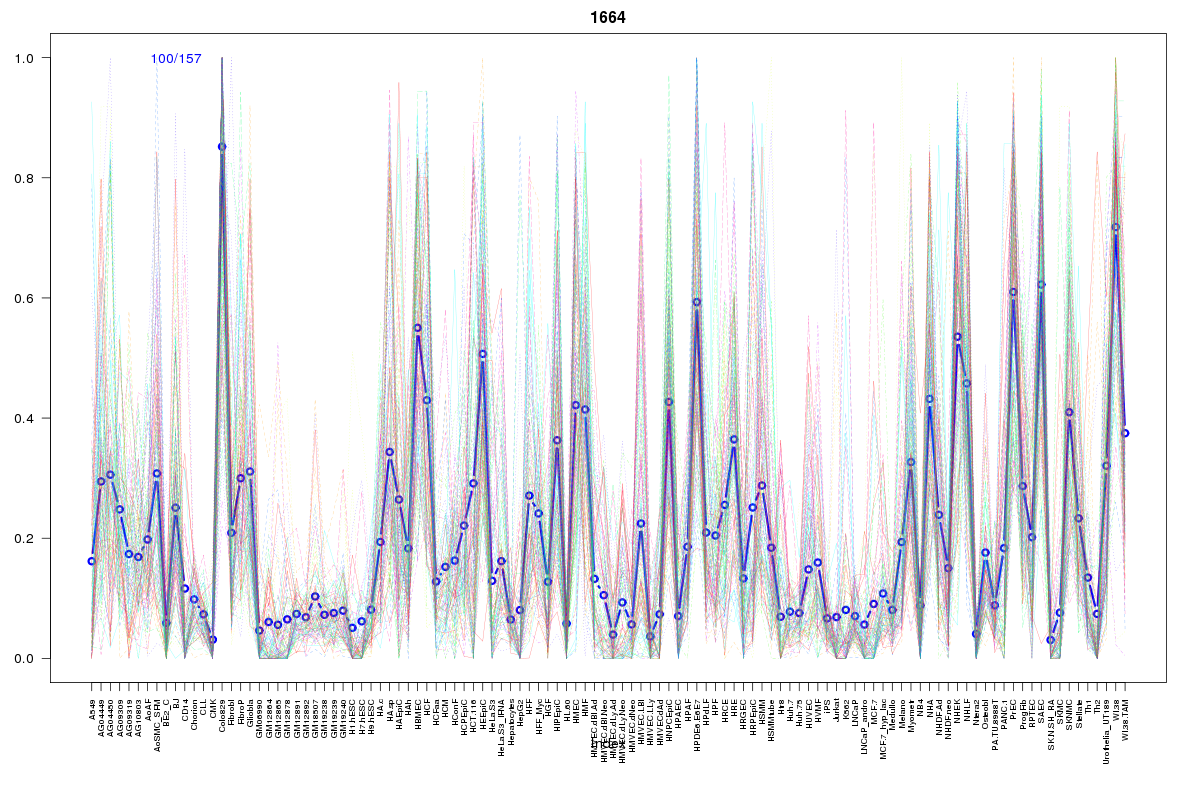
Cluster Hypersensitivity Profile

Genomic Location Trend
These plots show the distribution of the DHS sites surrounding the Transcript Start Site of the nearest gene.
Stats
Number of sites: 157Promoter: 1%
CpG-Island: 0%
Conserved: 42%
Enriched Motifs & Matches
Match Detail: [Jaspar]
|
| ||
|---|---|---|
| Sites: 58/100 | e-val: 1.8e-27 | ||
| Factor | e-val(match) | DB |
| NFE2L2 | 0.00000000011831 | JASPAR |
| AP1 | 0.0000000028862 | JASPAR |
| NFE2L1::MafG | 0.000054735 | JASPAR |
| Pax2 | 0.0088542 | JASPAR |
| PBX1 | 0.010259 | JASPAR |
BED file downloads
Top 10 Example Regions
| Location | Gene Link | Dist. |
|---|---|---|
| chr7: 65821460-65821610 | TPST1 | 46.59 |
| chr10: 28917500-28917650 | BAMBI | 47 |
| chr1: 144892180-144892330 | RP4-791M13.3 | 49.39 |
| chr1: 144892180-144892330 | NBPF9 | 49.39 |
| chrX: 109637980-109638130 | AMMECR1 | 57.64 |
| chr1: 151551960-151552110 | SNORA44 | 64.83 |
| chr1: 151551960-151552110 | TUFT1 | 64.83 |
| chr1: 151551960-151552110 | RP11-74C1.2 | 64.83 |
| chr3: 149212640-149212790 | WWTR1 | 66.44 |
| chr17: 20092720-20092870 | SPECC1 | 66.99 |