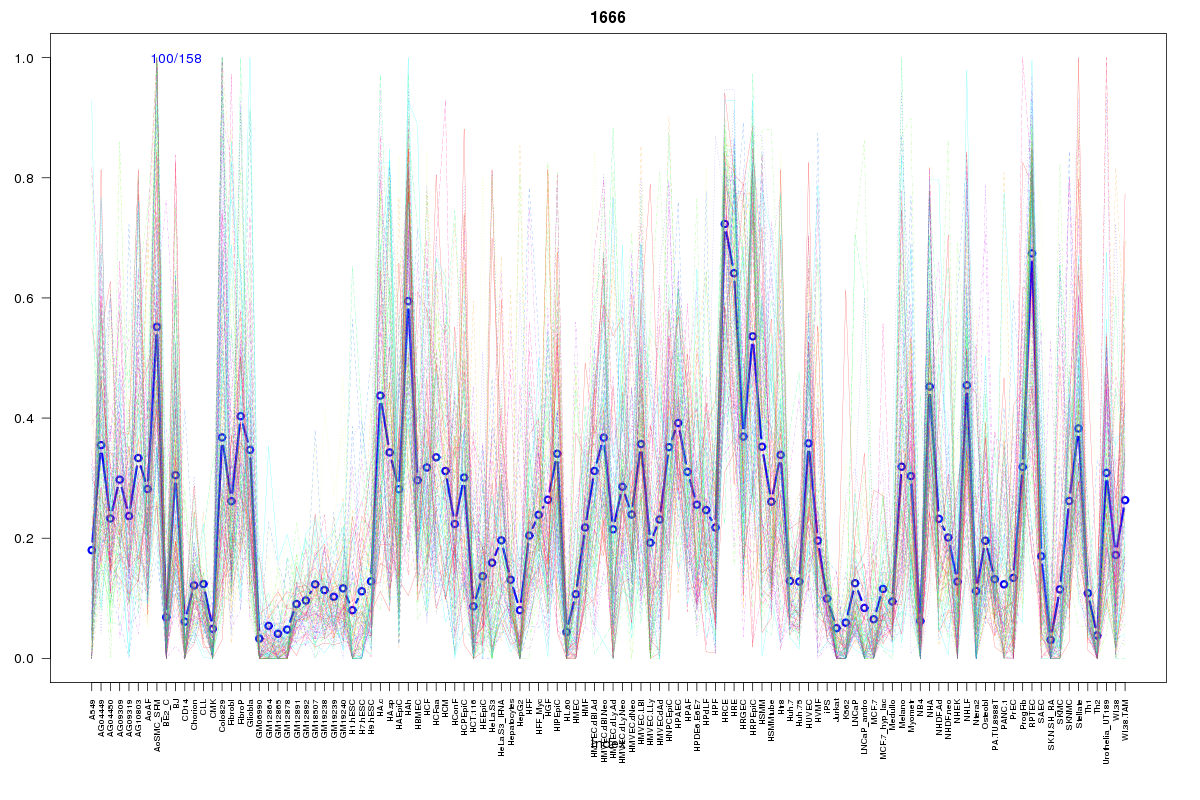
SOM cluster: 1666
Cluster Hypersensitivity Profile

Genomic Location Trend
These plots show the distribution of the DHS sites surrounding the Transcript Start Site of the nearest gene.
Stats
Number of sites: 158Promoter: 5%
CpG-Island: 0%
Conserved: 54%
Enriched Motifs & Matches
Match Detail: [Jaspar]
|
| ||
|---|---|---|
| Sites: 21/100 | e-val: 0.0000019 | ||
| Factor | e-val(match) | DB |
| ARID3A | 0.0020072 | JASPAR |
| Foxd3 | 0.010346 | JASPAR |
| Sox2 | 0.012074 | JASPAR |
| IRF1 | 0.013703 | JASPAR |
| MEF2A | 0.018325 | JASPAR |
|
| ||
| Sites: 25/100 | e-val: 0.76 | ||
| Factor | e-val(match) | DB |
| AP1 | 0.000000002719 | JASPAR |
| NFE2L2 | 0.000000013055 | JASPAR |
| NFE2L1::MafG | 0.00010292 | JASPAR |
| PBX1 | 0.0013672 | JASPAR |
| Pax6 | 0.013801 | JASPAR |
BED file downloads
Top 10 Example Regions
| Location | Gene Link | Dist. |
|---|---|---|
| chr5: 65736220-65736370 | RP11-305P14.1 | 28.92 |
| chr3: 156333440-156333590 | SSR3 | 33.51 |
| chr10: 93643460-93643610 | TNKS2-AS1 | 50.08 |
| chr10: 93643460-93643610 | FGFBP3 | 50.08 |
| chr11: 14468300-14468450 | RRAS2 | 61.9 |
| chr1: 67006420-67006570 | SGIP1 | 65.52 |
| chr9: 2810160-2810310 | KCNV2 | 65.74 |
| chr11: 3094265-3094415 | NAP1L4 | 70.89 |
| chr5: 139570240-139570390 | LINC01024 | 71.51 |
| chr1: 210057000-210057150 | C1orf74 | 74.98 |