SOM cluster: 1669
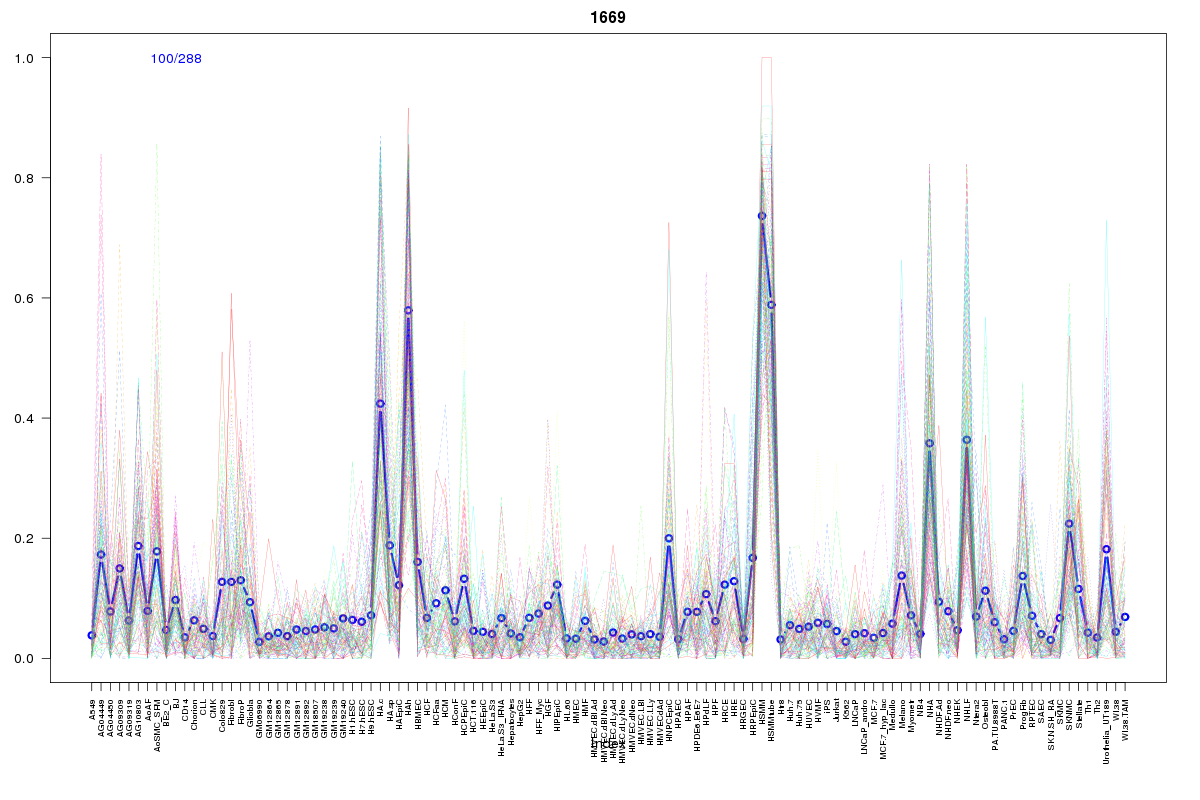
Cluster Hypersensitivity Profile

Genomic Location Trend
These plots show the distribution of the DHS sites surrounding the Transcript Start Site of the nearest gene.
Stats
Number of sites: 288Promoter: 2%
CpG-Island: 0%
Conserved: 50%
Enriched Motifs & Matches
Match Detail: [Jaspar]
|
| ||
|---|---|---|
| Sites: 19/100 | e-val: 0.0019 | ||
| Factor | e-val(match) | DB |
| RUNX1 | 0.00000029722 | JASPAR |
| FEV | 0.0014094 | JASPAR |
| SPIB | 0.0019613 | JASPAR |
| TEAD1 | 0.0035588 | JASPAR |
| HOXA5 | 0.0059161 | JASPAR |
BED file downloads
Top 10 Example Regions
| Location | Gene Link | Dist. |
|---|---|---|
| chr1: 149984680-149984830 | SF3B4 | 18.14 |
| chr18: 25440900-25441050 | CDH2 | 42.09 |
| chr18: 32383040-32383190 | DTNA | 55.96 |
| chr5: 36646820-36646970 | SLC1A3 | 67.06 |
| chr15: 88745620-88745770 | NTRK3 | 73 |
| chr9: 18795825-18795975 | ADAMTSL1 | 74.16 |
| chr11: 73175540-73175690 | RP11-809N8.4 | 74.76 |
| chr11: 73175540-73175690 | RELT | 74.76 |
| chr4: 151099460-151099610 | DCLK2 | 79.63 |
| chr10: 20543140-20543290 | PLXDC2 | 81.62 |